Quick answer
Learn Excel first, then Power BI. Excel is best for quick calculations, data entry and one-off analysis. Power BI is best for repeat reports, linked tables and shared dashboards. Power Query works in both, so cleaning skills carry over. Power BI Desktop is free; sharing needs Pro at $14 per user per month.
Key takeaways
- • Excel is a calculation tool that makes charts; Power BI is a reporting tool that calculates.
- • An Excel worksheet holds 1,048,576 rows, but workbooks get slow and fragile well before that.
- • Power Query is built into both tools, so cleaning skills learned in Excel move straight to Power BI.
- • Power BI Desktop is free; sharing reports needs Pro at $14 per user per month, paid yearly.
- • Learn in order: Excel basics, Power Query, data modeling, DAX, dashboards, then PL-300.
Table of contents 19 sections
- Power BI vs Excel: The Short Answer
- What Does Each Tool Do Best?
- Where Excel Wins
- Where Power BI Wins
- Where They Share the Same Engine
- Power BI vs Excel Side by Side
- How Much Data Can Each Tool Handle?
- What Do Excel and Power BI Cost in Pakistan?
- Which Tool Fits Your Task?
- Where Pakistani Businesses Use Each Tool
- A Textile Exporter in Faisalabad
- A Pharmaceutical Distributor in Lahore
- A Private School Network in Abbottabad
- Should You Learn Excel or Power BI First?
- The Skill Ladder From Spreadsheet User to Power BI Analyst
- Trade-Offs to Expect on the Way Up
- Is Power BI Worth Learning for Jobs and Freelancing?
- Learn Power BI With PSTA
- Your Next Step This Week
Should you learn Power BI or Excel first? It's one of the most common questions from students who want a data job, and the honest Power BI vs Excel answer is that you need both, in that order. Excel is where you check, calculate and explore. Power BI is where you model several tables, build dashboards and share them with a team that needs fresh numbers every morning.
The two tools overlap more than most people expect, so the real skill is knowing which one to open for a given task. This comparison is written for students, office staff and job seekers in Pakistan who want a clear decision rather than another feature list.
Here's what this comparison covers:
- What each tool does best, and where they share the same engine
- A side-by-side table of data size, cost, sharing and refresh limits
- A simple 2x2 grid for picking the right tool for any task
- Which one to learn first, based on where you're starting
- The skill ladder that takes you from spreadsheet user to Power BI analyst
Power BI vs Excel: The Short Answer
Excel is a calculation tool that can also make charts. Power BI is a reporting tool that can also do calculations. That one sentence settles most arguments.
If your work is a one-time analysis, a quick budget, or a list someone will edit by hand, Excel is faster. If the same report has to be rebuilt every week from the same sources, and several people need to see it, Power BI saves hours and removes copy-paste errors.
Most analyst job ads in Pakistan reflect this. Listings on Indeed Pakistan regularly ask for advanced Excel and Power BI together, from data entry roles that mention Excel only to BI developer roles built around dashboards. Employers don't treat them as rivals. They treat Excel as the floor and Power BI as the next step up.
What Does Each Tool Do Best?
Where Excel Wins
- Free-form work. You can type a number in any cell, add a note beside it and change a formula on the spot. Nothing in Power BI is that flexible.
- What-if questions. Goal Seek, scenario tables and quick formulas make Excel the natural home for pricing, loan and budget models.
- Data entry and small lists. Attendance sheets, stock counts and fee registers belong in a spreadsheet, not a dashboard.
- Familiarity. Nearly every office already uses it, so a file you send will open without training.
Where Power BI Wins
- Many tables at once. Sales, products, branches and dates can sit in one model linked by relationships, instead of long VLOOKUP chains.
- Repeatable reports. You build the cleaning steps once. Next month, you press Refresh and the whole report updates.
- Interactive dashboards. A manager clicks a city or a month and every chart filters with it.
- Controlled sharing. Reports live in the Power BI service, so people see one current version instead of five emailed copies.
Where They Share the Same Engine
Here's the part beginners miss. Power Query, the tool for importing and cleaning data, is built into both. Microsoft's Power Query documentation lists Excel for Windows, Excel for Mac and Power BI Desktop among the products that include it. So the cleaning steps you learn in Excel carry straight over to Power BI. That's the main reason Excel makes such a good first step.
Power BI vs Excel Side by Side
The table below uses figures from Microsoft's own pages, checked in October 2026. Prices are in US dollars because Microsoft lists them that way.
| Point of comparison | Excel | Power BI |
|---|---|---|
| Main purpose | Calculation, data entry, quick analysis | Data modeling, dashboards, shared reports |
| Size limit to know | 1,048,576 rows by 16,384 columns per worksheet | No worksheet grid; data loads into a model of related tables |
| Cost to start | Part of Microsoft 365 or Office, which most offices already pay for | Power BI Desktop is a free download |
| Cost to share with a team | Email or shared files | Pro at $14 per user per month, paid yearly |
| Automatic refresh | Manual refresh or Power Query refresh when you open the file | Up to 8 scheduled refreshes a day on Pro, up to 48 on Premium Per User |
| Data cleaning tool | Power Query | Power Query (same core editor) |
| Calculation language | Worksheet formulas | DAX measures and columns |
| Learning curve | Gentle at first, steep for advanced models | Steeper at first because of modeling and DAX |
The row limit comes from Microsoft's Excel specifications and limits page. Pricing comes from the Power BI pricing page, and the refresh limits from Microsoft's guide to data refresh in Power BI.
How Much Data Can Each Tool Handle?
An Excel worksheet stops at just over one million rows. That sounds like plenty until you meet a real business. A distributor with 40 salespeople, each logging dozens of invoice lines a day, can pass that limit within a year or two of history.
The row count is rarely the first problem, though. Long before you hit the limit, a workbook full of lookups and formulas becomes slow to open, slow to recalculate and easy to break. One wrong drag of a formula can change a total without anyone noticing.
Power BI handles this differently. Instead of one giant sheet, you keep separate tables for sales, products and customers, then link them. The report reads from that model, so adding another year of sales doesn't mean copying formulas down another 300,000 rows.
A fair note: Excel has its own Data Model and Power Pivot features that work in a similar way. If you've used them, you already know half of Power BI's modeling ideas.
What Do Excel and Power BI Cost in Pakistan?
For learning, the cost is close to zero. Microsoft describes Power BI Desktop as a free app, and you can build complete reports on your own laptop without paying anything. Note that Microsoft's documentation calls Desktop a Windows app, so Mac users usually need a Windows setup or the web version for some tasks.
Costs start when you share. According to Microsoft's pricing page, a free account lets you create reports, but sharing them needs a paid license. The two per-user plans listed are:
- Power BI Pro: $14 per user per month, paid yearly
- Power BI Premium Per User: $24 per user per month, paid yearly
For a small Pakistani business, this changes the math. Five managers on Pro is a real yearly expense in dollars, so many small firms keep sharing Excel files and only move to Power BI when report errors start costing more than the license. As an analyst, you'll often be the person who explains that trade-off to the owner.
If your company keeps data on a local server, Power BI can still refresh from it. Microsoft's on-premises data gateway is Windows software that connects the Power BI service to data inside your own network.
Which Tool Fits Your Task?
When students get stuck choosing, two questions usually settle it. How big and messy is the data? And who needs to see the result? Put those on two axes and you get a simple grid.
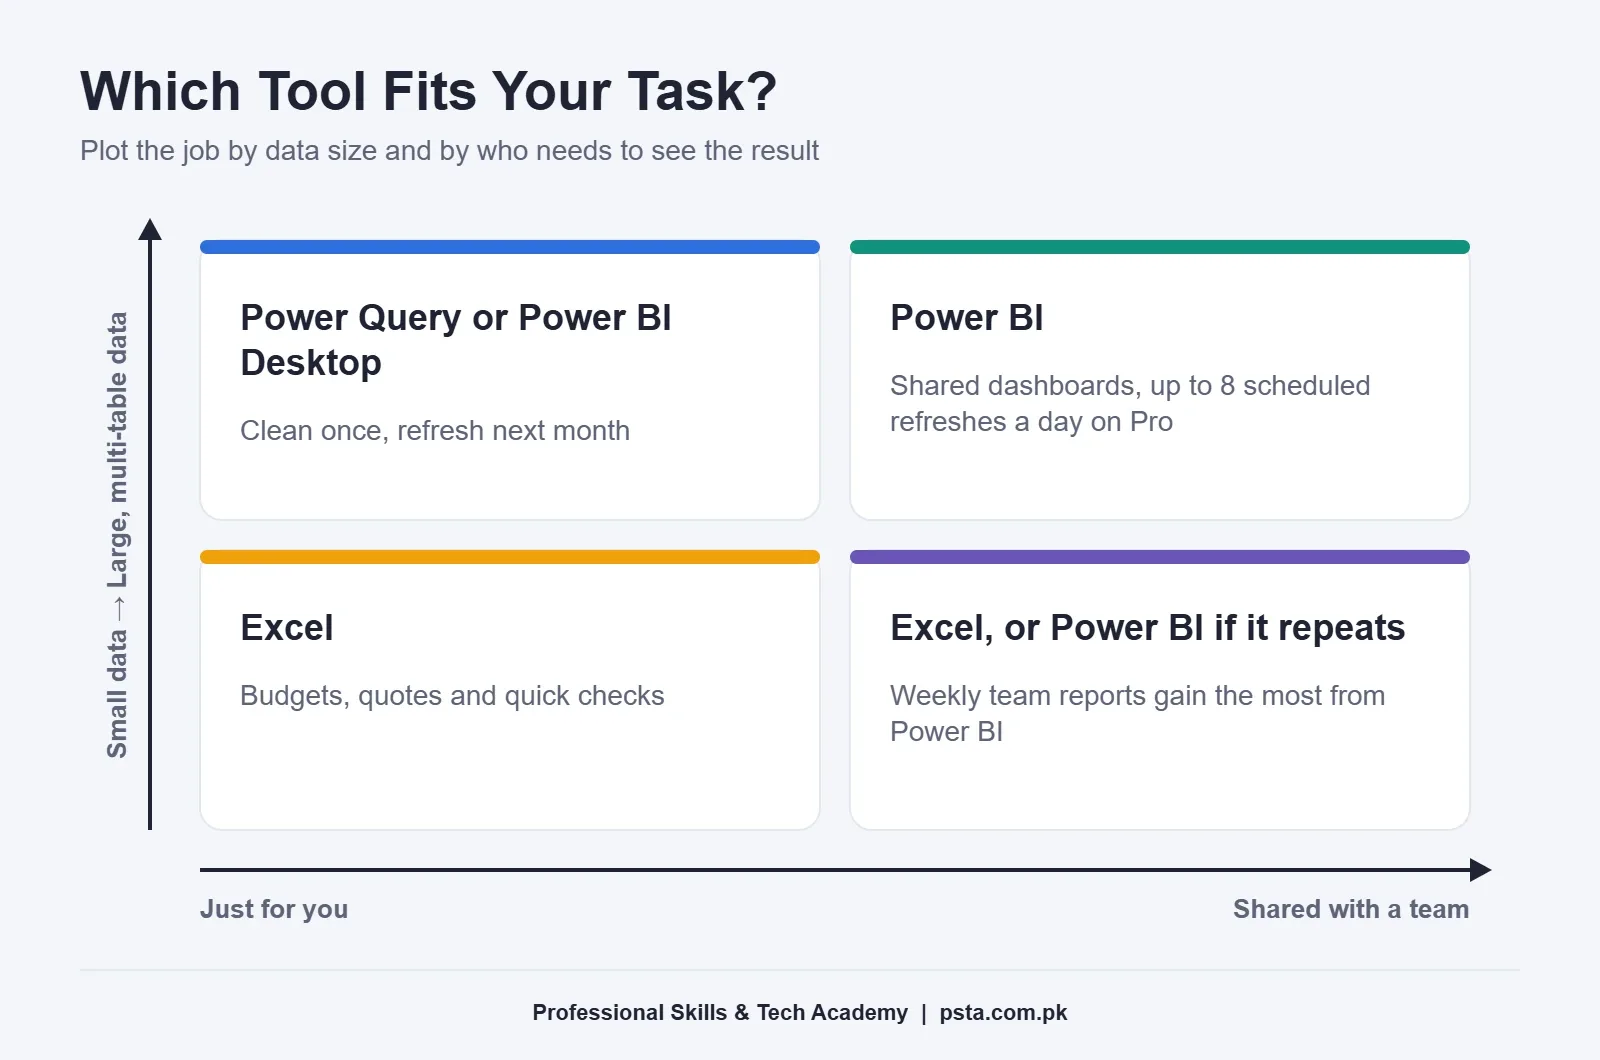
- Small data, just for you: Excel. A personal budget, a quote for a client or a quick check of last week's sales.
- Small data, shared with a team: Excel works, though Power BI helps if the same report repeats every week.
- Large data, just for you: Power Query inside Excel, or Power BI Desktop if you need several linked tables.
- Large data, shared with a team: Power BI. This is exactly the job it was designed for.
Where Pakistani Businesses Use Each Tool
The examples below are typical setups, described to show the pattern. They aren't case studies of named companies.
A Textile Exporter in Faisalabad
The costing team prices each order in Excel, because fabric rates, dye costs and exchange rates change daily and need quick edits. Management, meanwhile, watches a Power BI dashboard of orders by buyer, country and month that refreshes from the ERP each morning.
A Pharmaceutical Distributor in Lahore
Area managers once emailed separate Excel sheets every Friday. Someone then spent half a day merging them. A Power BI report connected to the billing system shows the same numbers by area, product and salesperson, and the merging step disappears.
A Private School Network in Abbottabad
Fee registers and attendance stay in Excel, since teachers update them by hand. Power BI is used at the head office to compare enrollment, fee recovery and results across campuses for the board meeting.
Notice the pattern. Excel stays close to the people entering or editing data. Power BI sits on top, where decisions are made.
Should You Learn Excel or Power BI First?
For most people, Excel comes first. You need to understand rows, columns, data types, sums and filters before a dashboard makes sense. But you don't need to master every Excel function before you open Power BI. Use this decision path instead.
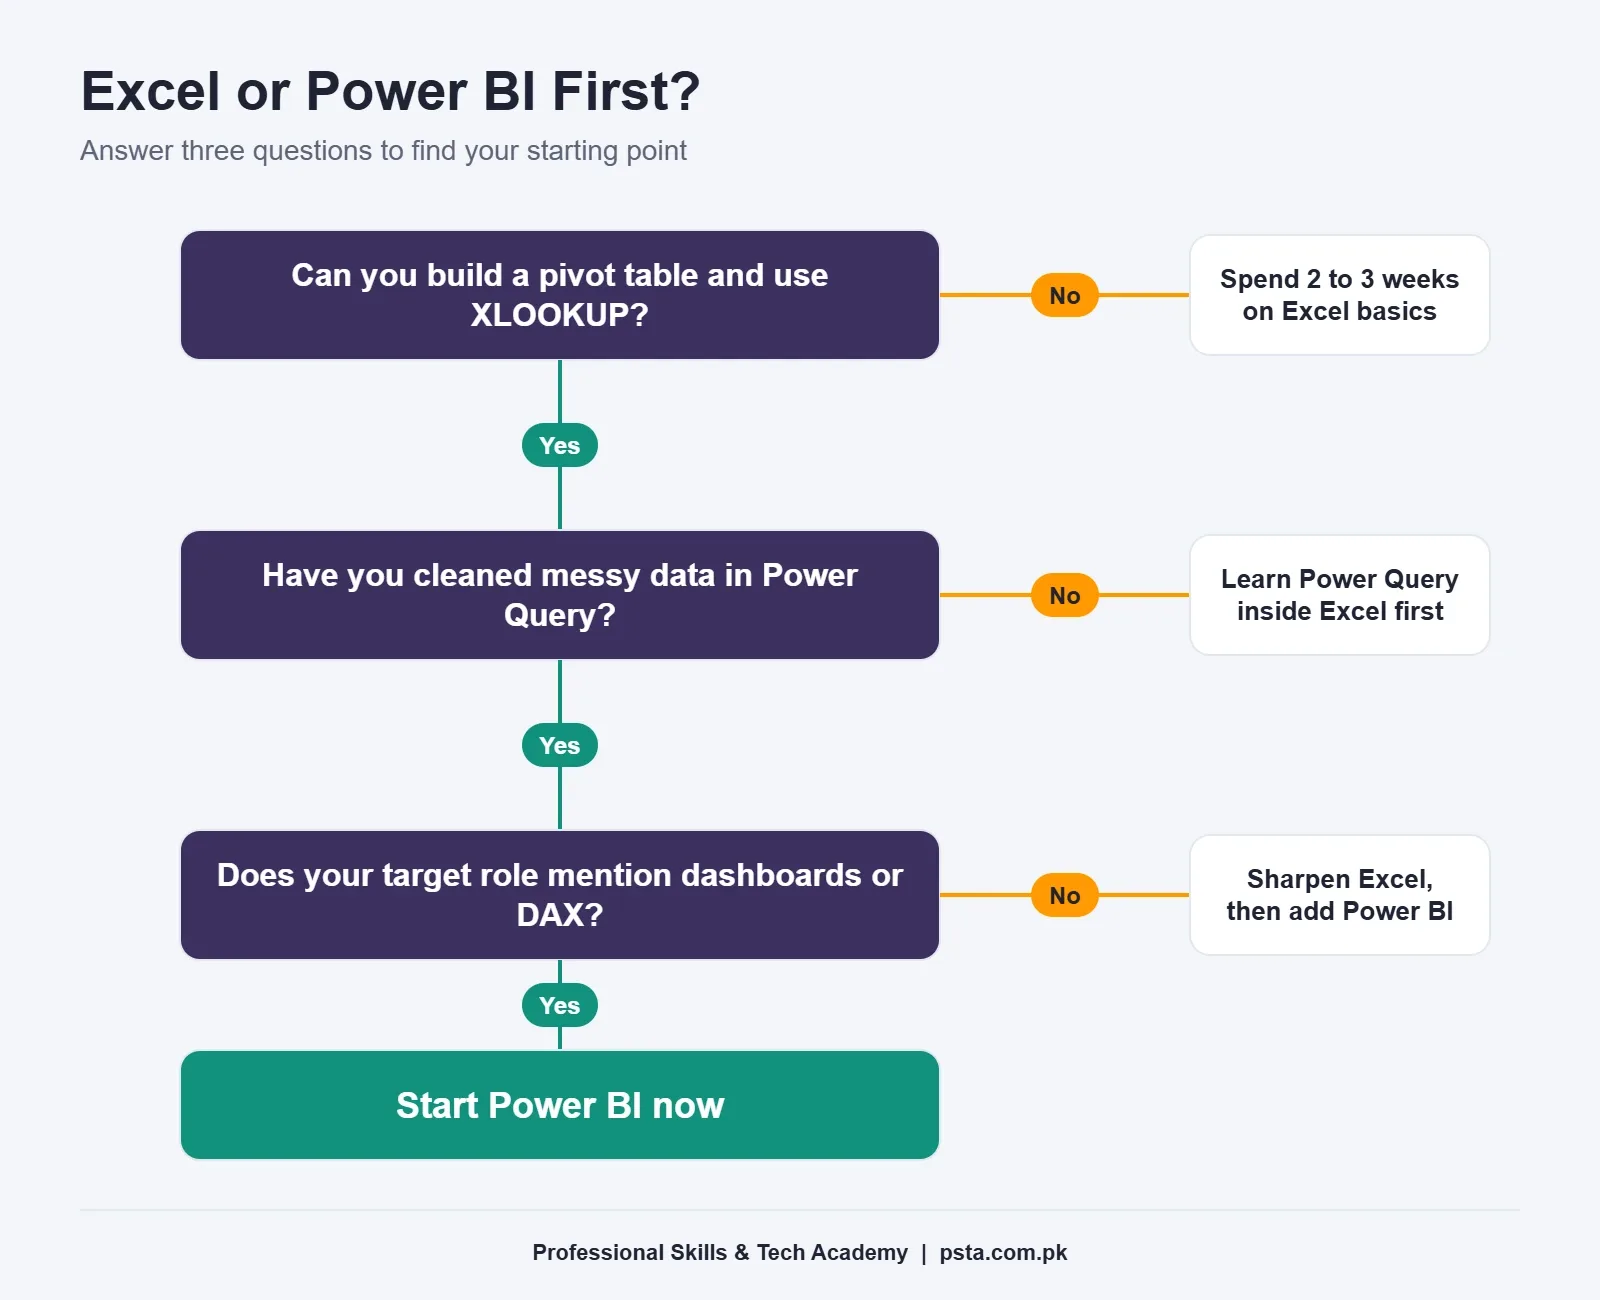
- Can you build a pivot table and write SUMIFS and XLOOKUP without help? If not, spend two to three weeks on Excel first. Our Office Automation course covers these basics.
- Have you cleaned messy data with Power Query? If not, learn it inside Excel. The same skill moves straight into Power BI.
- Does your job or target role mention dashboards, DAX or reporting? If yes, start Power BI now and keep Excel for quick checks.
- Are you aiming for analyst roles abroad or on freelance platforms? Add SQL and, later, Python. Our Advanced Python course and Oracle Database 19c course cover those next steps.
The Skill Ladder From Spreadsheet User to Power BI Analyst
Think of the move from Excel to Power BI as six steps. Each one builds on the last, and skipping a step is the most common reason beginners get confused by DAX.
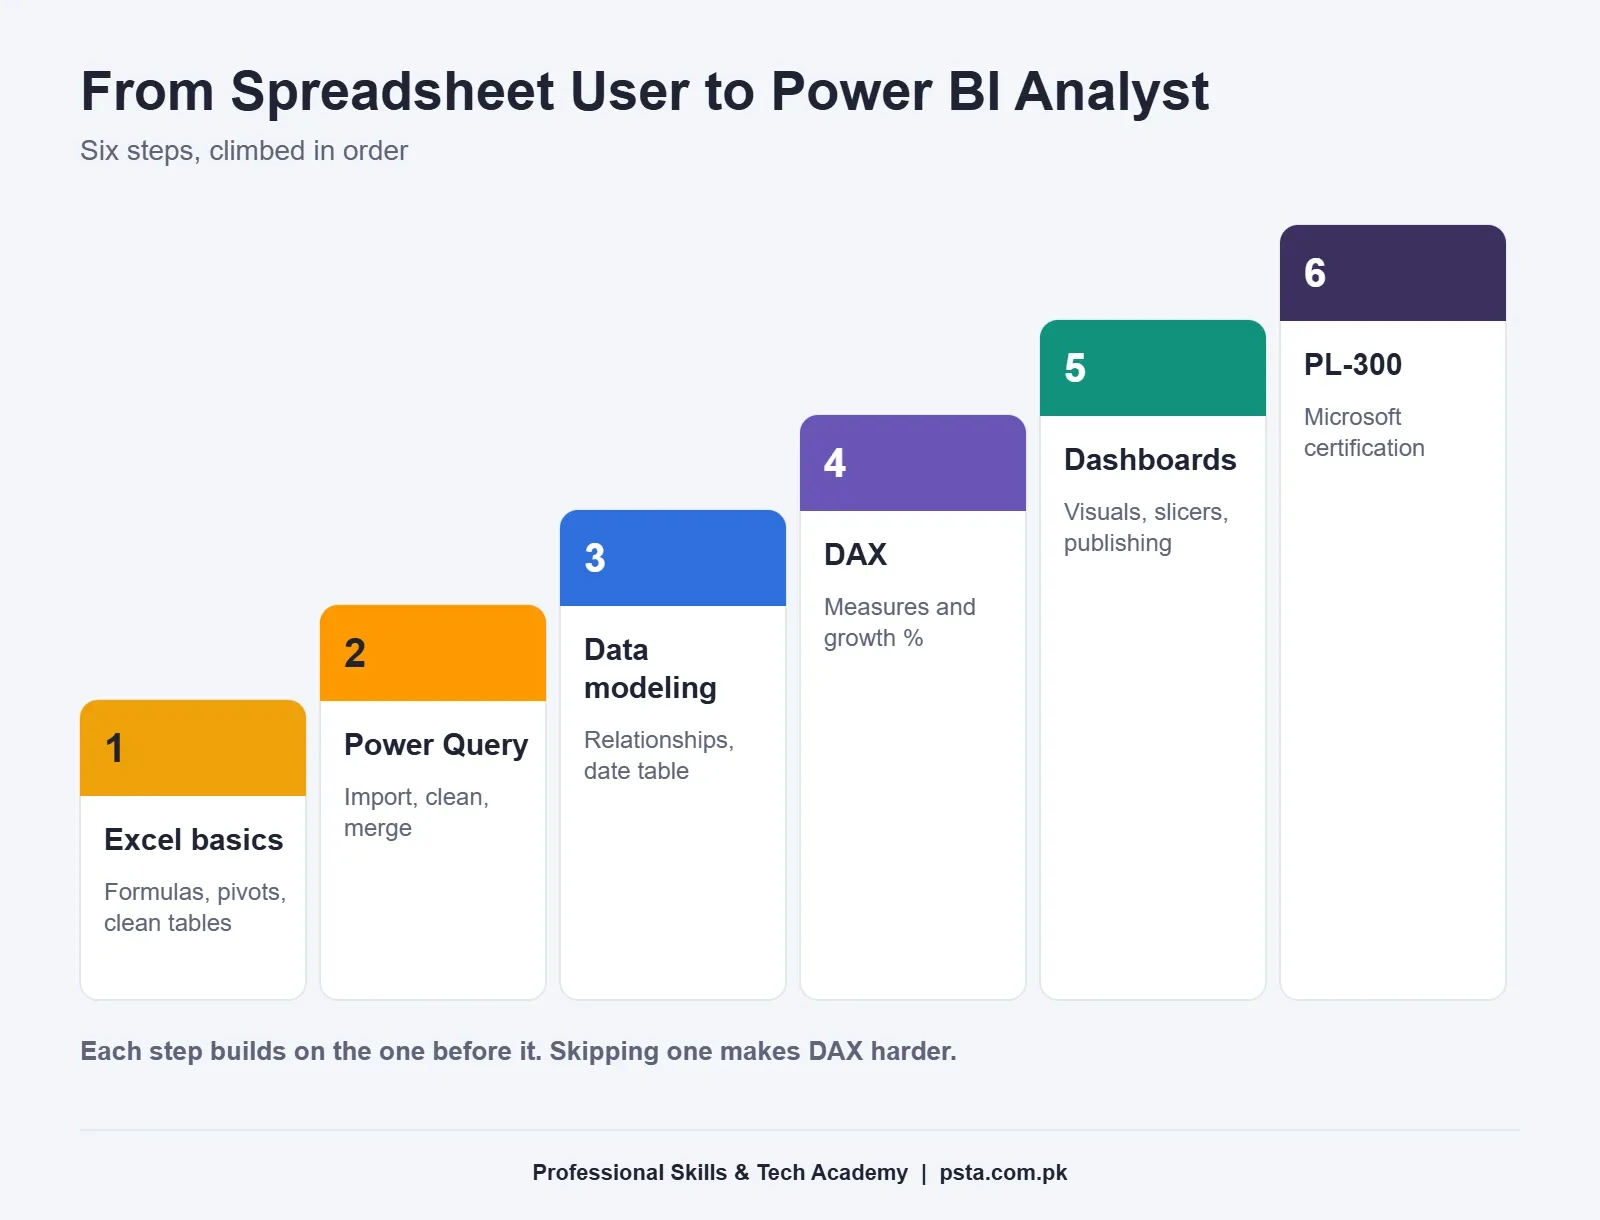
- Excel basics: formulas, sorting, filtering, pivot tables and clean table layout.
- Power Query: import files, remove junk rows, split columns, merge tables and save the steps.
- Data modeling: fact and dimension tables, relationships and a proper date table.
- DAX: measures such as total sales, sales last year and growth percentage.
- Dashboards and publishing: clear visuals, slicers, mobile layout and sharing through the Power BI service.
- Certification: Microsoft's PL-300 exam for the Power BI Data Analyst Associate credential.
About that last step: Microsoft's PL-300 certification page lists a 100-minute proctored exam covering data preparation, modeling, visualization and security. The credential must be renewed every 12 months through a free online assessment, and the exam price depends on the country where you take it. A certificate helps, but a portfolio of two or three real dashboards usually matters more in interviews.
Trade-Offs to Expect on the Way Up
Power BI isn't always the better choice, and good analysts say so.
- Power BI takes longer to set up. For a report you'll use once, Excel is faster every time.
- DAX has a real learning curve. Concepts like filter context feel strange at first. Plan for a few weeks of practice.
- Sharing costs money. The free Desktop app is enough for learning, but a team rollout needs licenses.
- Bad data stays bad. A dashboard built on messy source data just shows wrong numbers more attractively.
- Managers still ask for Excel. Expect "Can you export this?" often. Knowing both tools keeps you useful.
Is Power BI Worth Learning for Jobs and Freelancing?
The wider trend supports data skills. In its Future of Jobs Report 2025, the WEF puts AI and big data at the top of its list of skills growing quickest, and reports that seven out of 10 employers now see analytical thinking as a core skill.
On freelance platforms, rates vary widely. When we checked Upwork's page for Power BI specialists in Pakistan in October 2026, the profiles shown listed hourly rates between $5 and $16. That's a small sample of featured profiles, not an average, and new freelancers usually start at the lower end until they have reviews.
When it comes to Power BI vs Excel, employers rarely make you pick one. No tool guarantees a job, either. What helps is pairing Power BI with solid Excel, a little SQL and a portfolio built on realistic data.
Learn Power BI With PSTA
PSTA's Power BI course is a beginner-level, 8-week program available online across Pakistan and on campus in Abbottabad. The current fee is Rs. 32,000, discounted from Rs. 35,000.
The course follows the same ladder described above:
- Data connectivity from SQL, Excel, web and cloud sources
- Data transformation with Power Query
- Data modeling and relationships
- DAX measures and calculated columns
- Interactive dashboards, visualizations and custom charts
- Power BI service, online publishing, governance and security
- Real-world business case projects
If you're starting from zero with computers, our Office Automation course is a gentler first step. You can compare options on the courses page. If you're curious how data skills connect with automation, read our guide on how to learn AI automation in Pakistan.
Your Next Step This Week
Take one report you already make in Excel, such as monthly sales or fee collection. Download Power BI Desktop, load the same file and rebuild just one chart with a slicer for month. You'll see within an hour whether the switch saves you time.
If you'd like guided practice with real business data, check the batch timings and apply for admission. Questions about the Power BI batch can go to +92 314 5424399 on WhatsApp, or drop by our Abbottabad campus (Mandian, Old College Road, opposite FIMS College).
Frequently asked questions
Is Power BI harder to learn than Excel?
Power BI feels harder at the start because you have to learn data modeling and DAX, which work differently from worksheet formulas. If you already use pivot tables and Power Query in Excel, the gap is much smaller. Most beginners with solid Excel skills can build a useful first dashboard within a few weeks of regular practice.
Can Power BI replace Excel completely?
No. Power BI is built for reporting and dashboards, while Excel is better for data entry, quick calculations, what-if models and one-off analysis. In most offices the two work together: people enter and check data in Excel, and Power BI pulls that data into shared reports that refresh on a schedule.
Is Power BI Desktop really free?
Yes. Microsoft offers Power BI Desktop as a free download, and you can build full reports on your own computer without a license. You only need a paid plan, such as Power BI Pro at $14 per user per month paid yearly, when you want to share reports with other people through the Power BI service.
Does Power BI work on a Mac?
Microsoft describes Power BI Desktop as a Windows app, so it does not install directly on macOS. Mac users usually run it through a Windows setup or use the web-based Power BI service for viewing and some editing. If you plan to build reports regularly, a Windows laptop makes practice much easier.
How many rows can Excel handle compared with Power BI?
An Excel worksheet holds up to 1,048,576 rows and 16,384 columns. Power BI has no worksheet grid; it loads data into a model of related tables, which suits multi-year sales or transaction data far better. In practice, Excel files often become slow and fragile well before they reach the row limit.
Do I need SQL to get a Power BI job?
SQL isn't required to start, but many analyst roles in Pakistan list it alongside Excel and Power BI because company data often lives in databases. Learning basic SELECT, JOIN and GROUP BY queries lets you pull exactly the data you need before building a report, and it makes your CV stronger.
Is the PL-300 certification worth it?
PL-300 earns you the Microsoft Certified: Power BI Data Analyst Associate credential, which shows employers you know data preparation, modeling, visualization and security. It is renewed every 12 months through a free online assessment. A certificate helps, but two or three portfolio dashboards built on realistic data usually carry more weight in interviews.
Sources & references
- Power BI pricing microsoft.com
- Power BI Desktop microsoft.com
- Excel specifications and limits support.microsoft.com
- Data refresh in Power BI learn.microsoft.com
- What is Power Query? learn.microsoft.com
- Microsoft Certified: Power BI Data Analyst Associate (PL-300) learn.microsoft.com
- WEF Future of Jobs Report 2025 weforum.org
- Upwork: Power BI specialists in Pakistan upwork.com
Last reviewed & updated on by Umar Qureshi. Written by the PSTA team in Abbottabad, Pakistan.

Umar Qureshi

Power BI Course: Data Analytics & Dashboards
Turn this guide into a career: hands-on training with real projects, online across Pakistan or on-campus in Abbottabad · 8 Weeks.


Comments
No comments yet — ask a question or share your experience.