Quick answer
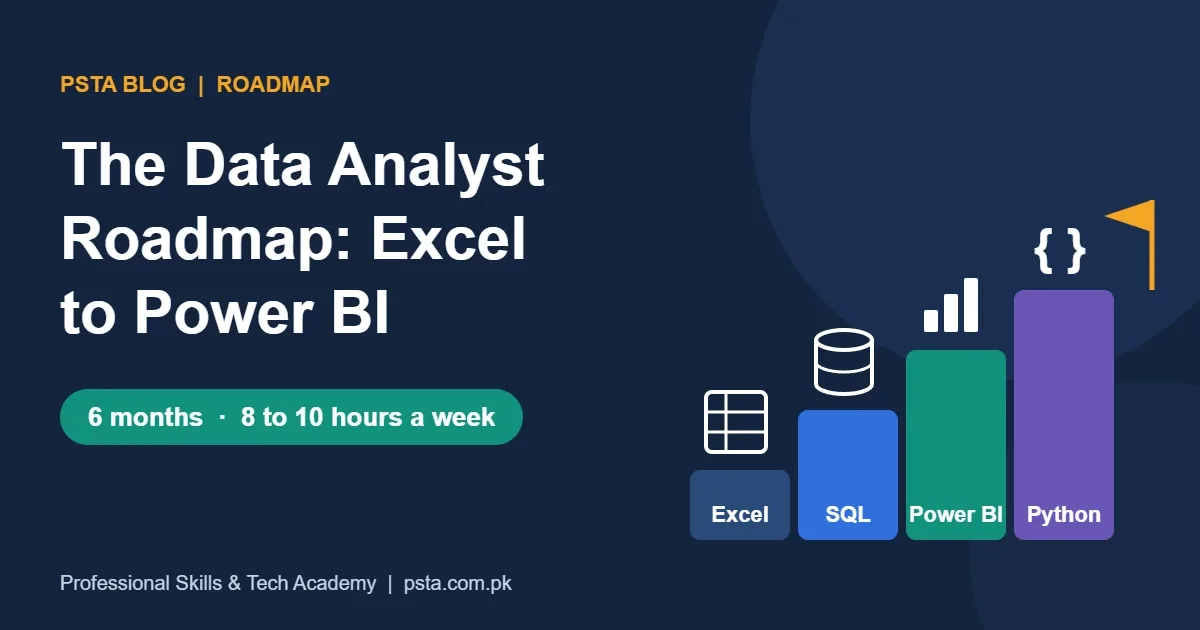
Follow a six-month data analyst roadmap: Excel in Month 1, SQL in Month 2, Power BI in Months 3 and 4, Python basics in Month 5, then three portfolio projects in Month 6. Study 8 to 10 hours a week, take PL-300 only after Power BI, and apply for MIS and reporting roles too.
Key takeaways
- • Learn in order: Excel, SQL, Power BI, Python, then a portfolio.
- • Power BI Desktop is free but runs on Windows only; Microsoft recommends 4 GB of RAM or more.
- • WEF's Future of Jobs Report 2025 puts big data specialists first among the fastest-growing jobs.
- • PL-300 lasts 100 minutes, needs a score of 700 and renews free every year.
- • Three small, honest projects with written summaries beat a stack of certificates.
- • Search for MIS, reporting and BI intern roles, not only "Data Analyst."
Table of contents 12 sections
- What Does a Data Analyst Do, and Is the Role Growing?
- Before You Start: Laptop, Software and Weekly Hours
- The 6-Month Data Analyst Roadmap at a Glance
- Month 1: Which Excel Skills Do Employers Actually Test?
- Month 2: SQL So You Can Pull Your Own Data
- Months 3 and 4: Power BI From Messy File to Published Report
- Month 5: Python Basics for Analysts
- Month 6: Portfolio Projects That Prove You Can Do the Work
- Should You Take the PL-300 Exam?
- How Do You Land Your First Analyst Role?
- Studying the Power BI Stage With PSTA
- Pick Your Practice Dataset Tonight
Before you follow any data analyst roadmap, answer these five questions with a quick yes or no. Can you sort and filter a sheet of 2,000 rows in Excel? Can you explain what a SUMIFS formula does? Have you ever written a SQL query that joins two tables? Have you built a chart that someone else used to make a decision? Could you describe one business problem you solved with numbers?
If you said no to most of them, good. The plan below was written for you. It takes a beginner from basic spreadsheets to a small, honest portfolio in about six months of steady part-time study, using tools that Pakistani employers already run: Excel, SQL and Power BI, with Python as a later add-on.
Here is what the rest of this page covers:
- Which skill to learn in each month, and why the order matters
- What laptop and software you need before you begin
- How to build three portfolio projects from public or local data
- Whether the Microsoft PL-300 exam is worth your money right now
- How to apply for your first analyst role without overselling yourself
What Does a Data Analyst Do, and Is the Role Growing?
A data analyst turns raw records into answers a manager can act on. In a Pakistani company, that might mean a sales coordinator at a pharma distributor in Peshawar checking which territories missed target, or an operations officer at a courier company in Lahore tracking late deliveries by city. The questions are usually plain: what happened, where, and why.
Most of the work is unglamorous. You collect data from a system or a shared drive, fix messy columns, join tables, calculate figures and then present them so a busy person understands them in under a minute. Tools change, but that cycle, and the core data analyst skills behind it, stays the same.
Is the demand real? The World Economic Forum's Future of Jobs Report 2025 surveyed more than 1,000 employers and placed big data specialists at the top of its fastest-growing jobs list. Its skills chapter says seven out of 10 companies consider analytical thinking a core skill, and it names AI and big data as the fastest-growing skills.
At home, the tech sector keeps expanding. The Express Tribune reported, citing State Bank of Pakistan data, that IT exports reached a record $4.6 billion in FY2025-26, up 21% from $3.814 billion a year earlier. More software and services work means more companies that need someone to read their numbers.
Before You Start: Laptop, Software and Weekly Hours
You don't need an expensive machine. Power BI Desktop, the tool you'll use most in this plan, is a free download. According to Microsoft's install guide, the minimum is Windows 10, with 2 GB of free RAM as the floor and 4 GB or more advised, and a screen of at least 1440 x 900. It runs on Windows only, so Mac users need a Windows virtual machine or a separate PC.
| Item | Minimum | What I Suggest to Students |
|---|---|---|
| Operating system | Windows 10 or later | Windows 10 or 11, fully updated |
| Memory | 2 GB available | 8 GB total, so Excel and Power BI can stay open together |
| Screen | 1440 x 900 | A 15-inch Full HD laptop screen or an external monitor |
| Software | Excel, Power BI Desktop | Add a free SQL database and a free code editor in Month 2 |
| Time | No official figure | 8 to 10 hours a week, spread over at least four days |
Microsoft updates Power BI Desktop every month and supports only the latest version. Install it from the Microsoft Store so updates arrive on their own. Load-shedding is a real factor too, so keep your practice files in a cloud folder that syncs.
The 6-Month Data Analyst Roadmap at a Glance
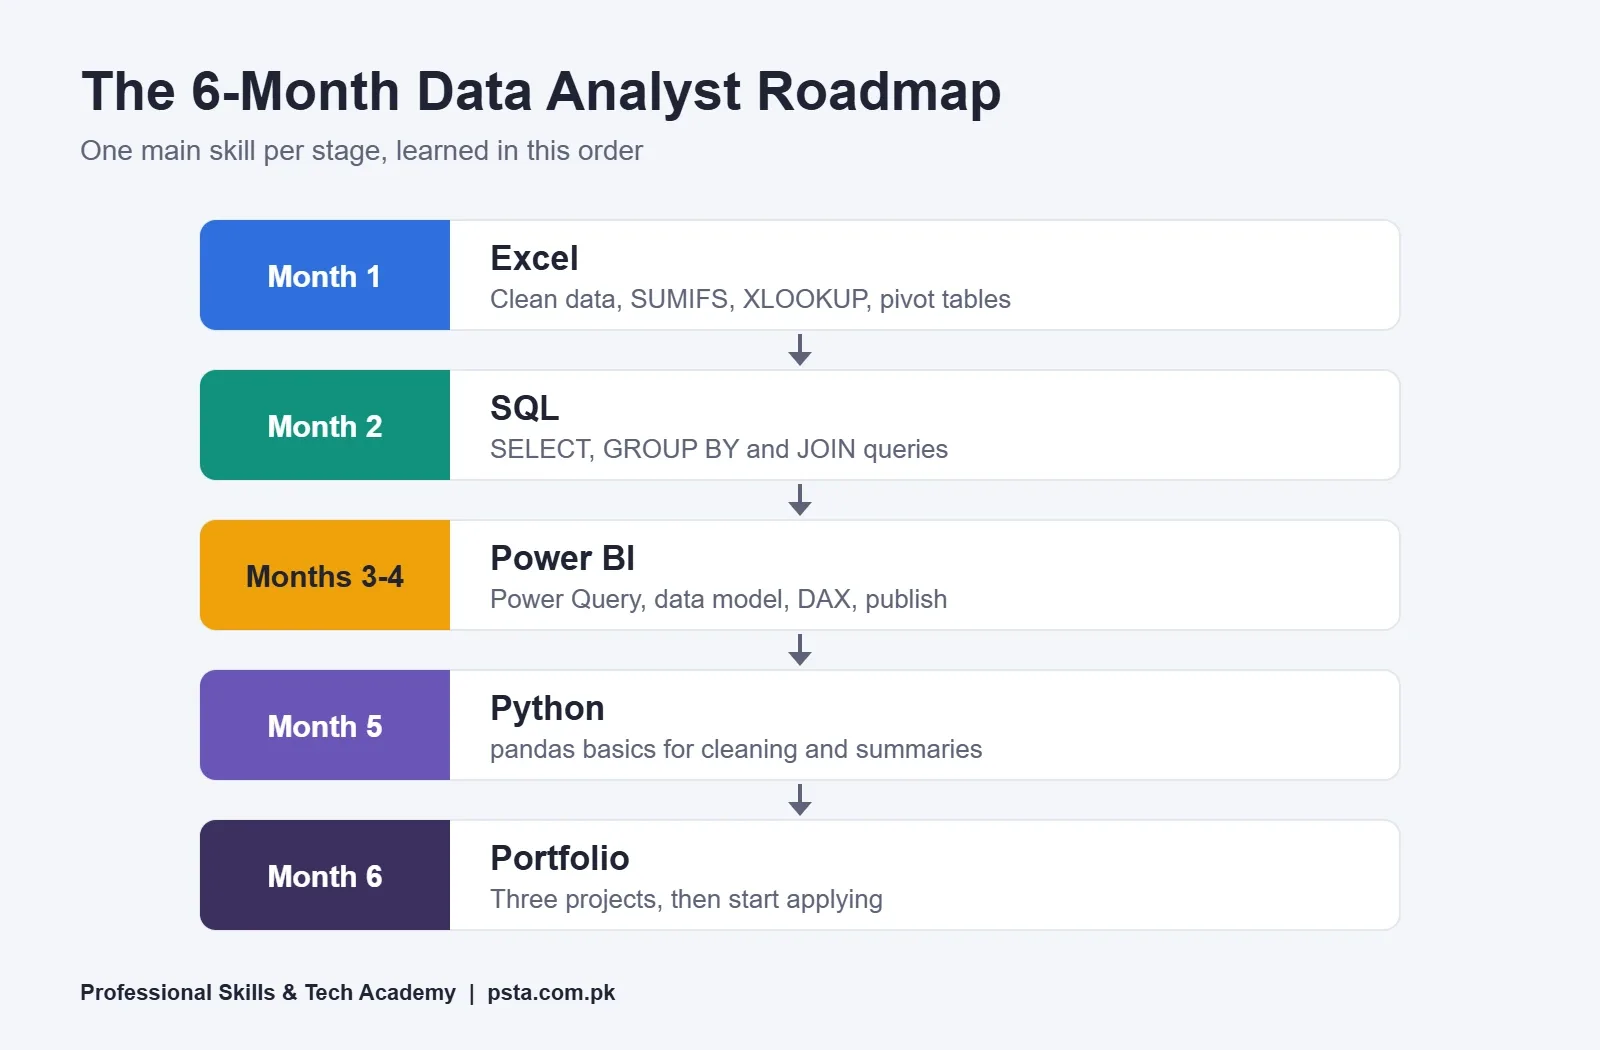
The order below is deliberate. Excel teaches you how tables behave. SQL teaches you to pull data yourself instead of waiting for someone to email a file. Power BI then combines both into reports, and Python comes last because it's easier once you already think in rows and columns.
| Stage | Main Skill | You've Finished When You Can... |
|---|---|---|
| Month 1 | Excel | Clean a messy sheet, use SUMIFS and XLOOKUP, and summarize it with a pivot table |
| Month 2 | SQL | Write SELECT, WHERE, GROUP BY and JOIN queries without copying them |
| Months 3 and 4 | Power BI | Clean data in Power Query, build a star-schema model, write basic DAX measures and publish a report |
| Month 5 | Python basics | Load a CSV with pandas, clean it and produce a summary table |
| Month 6 | Portfolio and applications | Show three finished projects and explain each one in two minutes |
If you already work in an office and use Excel daily, you can compress Month 1 into two weeks. If you've never used a computer for work, add a month of basics before you begin.
Month 1: Which Excel Skills Do Employers Actually Test?
If an employer gives you an Excel test for a junior reporting role, expect it to check a familiar handful of skills. Focus on these, in this order:
- Clean data first. Remove extra spaces with TRIM, split full names with Text to Columns, and fix dates stored as text.
- Use conditional totals. SUMIFS, COUNTIFS and AVERAGEIFS answer most "how much, by whom" questions.
- Look up values. Learn XLOOKUP, and know VLOOKUP well enough to read older files that use it.
- Summarize with pivot tables. Our pivot table walkthrough covers the layout options step by step.
- Chart honestly. Use bar charts for comparisons and line charts for time. Skip 3D effects.
Practice on one dataset all month, such as a year of sales from a small shop. Working with the same file teaches you more than jumping between 20 tutorial sheets.
Month 2: SQL So You Can Pull Your Own Data
Most company data lives in databases, not spreadsheets. An analyst who can write a query gets answers in minutes instead of waiting days for the IT team. You don't need to become a database administrator. You need to read data, not manage servers. Think of this month as SQL for data analysis.
Spend the first two weeks on SELECT, WHERE, ORDER BY and aggregate functions such as SUM and COUNT with GROUP BY. Spend the next two weeks on joins, because real questions almost always span two or more tables. Our guide to SQL joins uses examples you can type out yourself.
Which database should you use? It matters less than people think. SQL syntax is mostly shared across MySQL, PostgreSQL, SQL Server and Oracle. Pick one that installs cleanly on your laptop and stay with it for the month.
Months 3 and 4: Power BI From Messy File to Published Report
This is the longest stage of the data analyst roadmap, and for good reason. Power BI is where your Excel and SQL habits turn into something a manager can open on a phone. If you have searched for Power BI for beginners and felt lost, follow this split of the eight weeks:
- Weeks 1 and 2, Power Query: connect to Excel files, CSVs and a database, then remove blank rows, fix data types and merge tables.
- Weeks 3 and 4, data modeling: arrange your tables as a star schema, where a central fact table links to a few dimension tables, and check every relationship.
- Weeks 5 and 6, DAX: write measures such as total sales, previous-month sales and percentage change. Keep each measure small and named clearly.
- Weeks 7 and 8, report design: plan one page per question, add slicers sparingly and publish to the Power BI service.
The step most beginners rush is the model. A clean model makes DAX short and reports fast. A tangled one makes every later step painful.
Month 5: Python Basics for Analysts
Python isn't required for every first job, but it widens your options and helps with tasks that are clumsy in Power BI, such as combining dozens of files or cleaning text. Stay focused on what analysts use:
- Variables, lists, loops and functions, enough to read simple scripts
- pandas for loading, filtering, grouping and merging tables
- Basic charts with matplotlib
- Jupyter notebooks, so your steps and results sit together
Skip machine learning for now. A junior analyst who can clean and summarize data reliably is more useful than one who has half-finished a prediction model.
Month 6: Portfolio Projects That Prove You Can Do the Work
Certificates show you attended something. Projects show you can do the job, which is why the last month of any data analyst roadmap should go to them. Build a data analyst portfolio of three projects, each answering a real question, and keep them small enough to finish.
- Project 1, Excel: a monthly sales summary for a hypothetical Abbottabad grocery store, with a pivot table and two charts.
- Project 2, SQL plus Power BI: a delivery-performance report for an example courier business, showing late orders by city and week.
- Project 3, Power BI or Python: an analysis of a public dataset, such as Pakistan Bureau of Statistics tables, that answers one clear question.
A copied dashboard with no stated question tells a reviewer nothing about your thinking, and neither does a page with every chart crowded onto it. Label made-up data as sample data. Employers respect honesty, and they will ask how you built each file. If you want more starting points, browse these beginner Power BI project ideas.
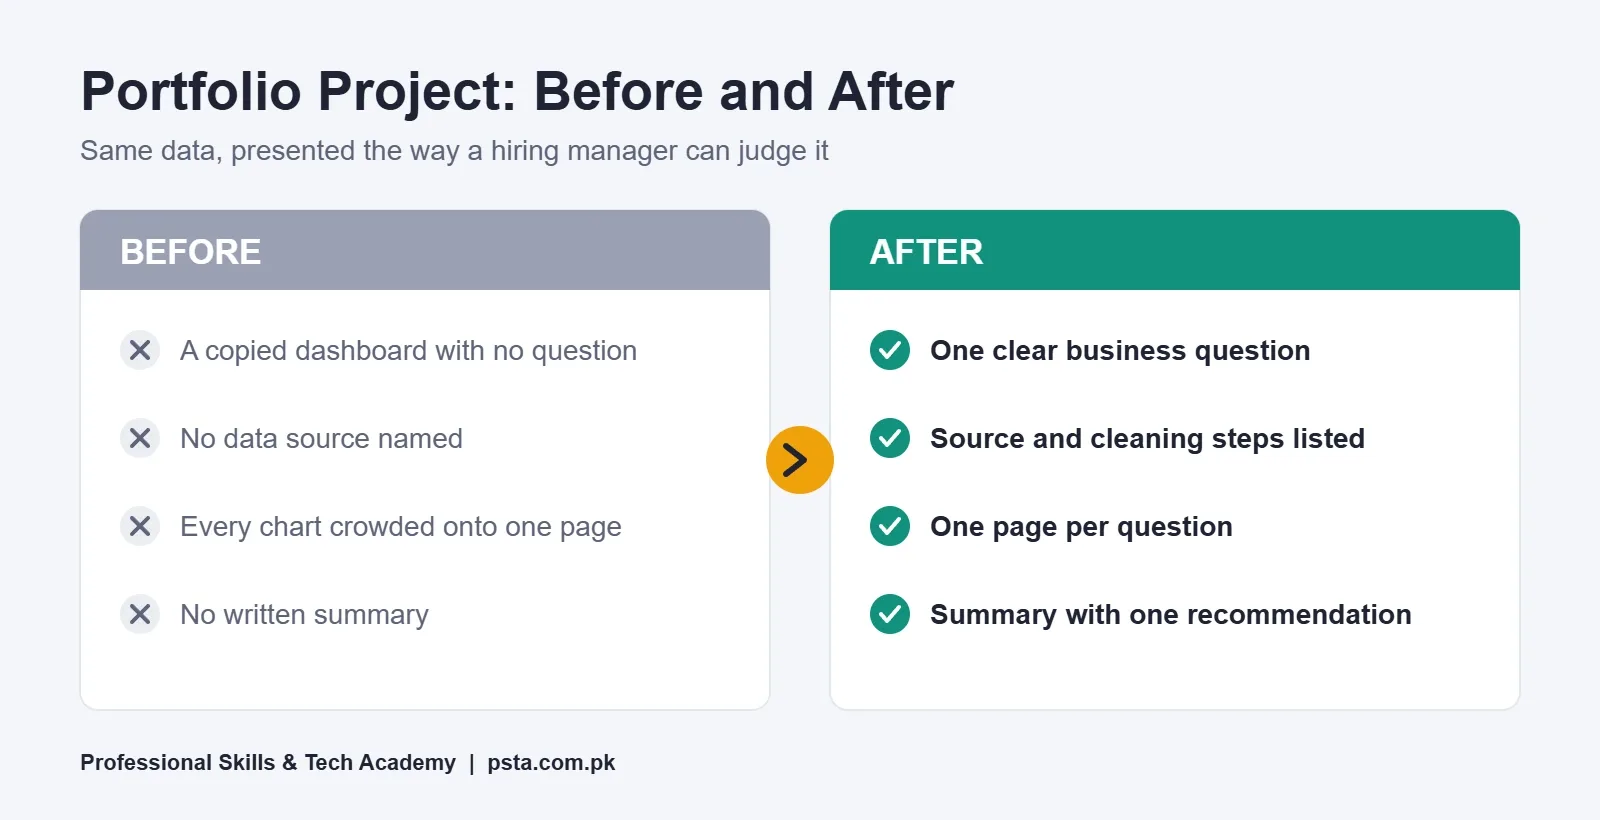
Each project should include a one-paragraph summary at the top: the question, the data source, what you found and one recommendation. A busy reviewer may read only that paragraph before deciding whether to open the file.
Should You Take the PL-300 Exam?
Passing PL-300 earns you Microsoft's Power BI Data Analyst Associate certification. It's useful, but in this data analyst roadmap it isn't step one. Take it after Month 4 if your target employers use Microsoft tools, or later if your budget is tight.
| Detail | What Microsoft Says |
|---|---|
| Exam length | 100 minutes, proctored |
| Passing score | 700 or greater |
| Skill areas | Prepare the data (25-30%), model the data (25-30%), visualize and analyze (25-30%), manage and secure (15-20%) |
| Price | Varies by country; shown when you schedule with Pearson VUE |
| Renewal | Yearly, by passing a free assessment on Microsoft Learn |
Sources: Microsoft's certification page and the PL-300 study guide, whose skills list is current as of April 20, 2026. Check the price yourself on the scheduling screen before you plan around it, since it is not published as a fixed figure.
Before paying, use Microsoft's free practice assessment and the exam sandbox, which lets you try the question formats. If you fail, Microsoft allows a retake after 24 hours, though later retakes have longer waits.
How Do You Land Your First Analyst Role?
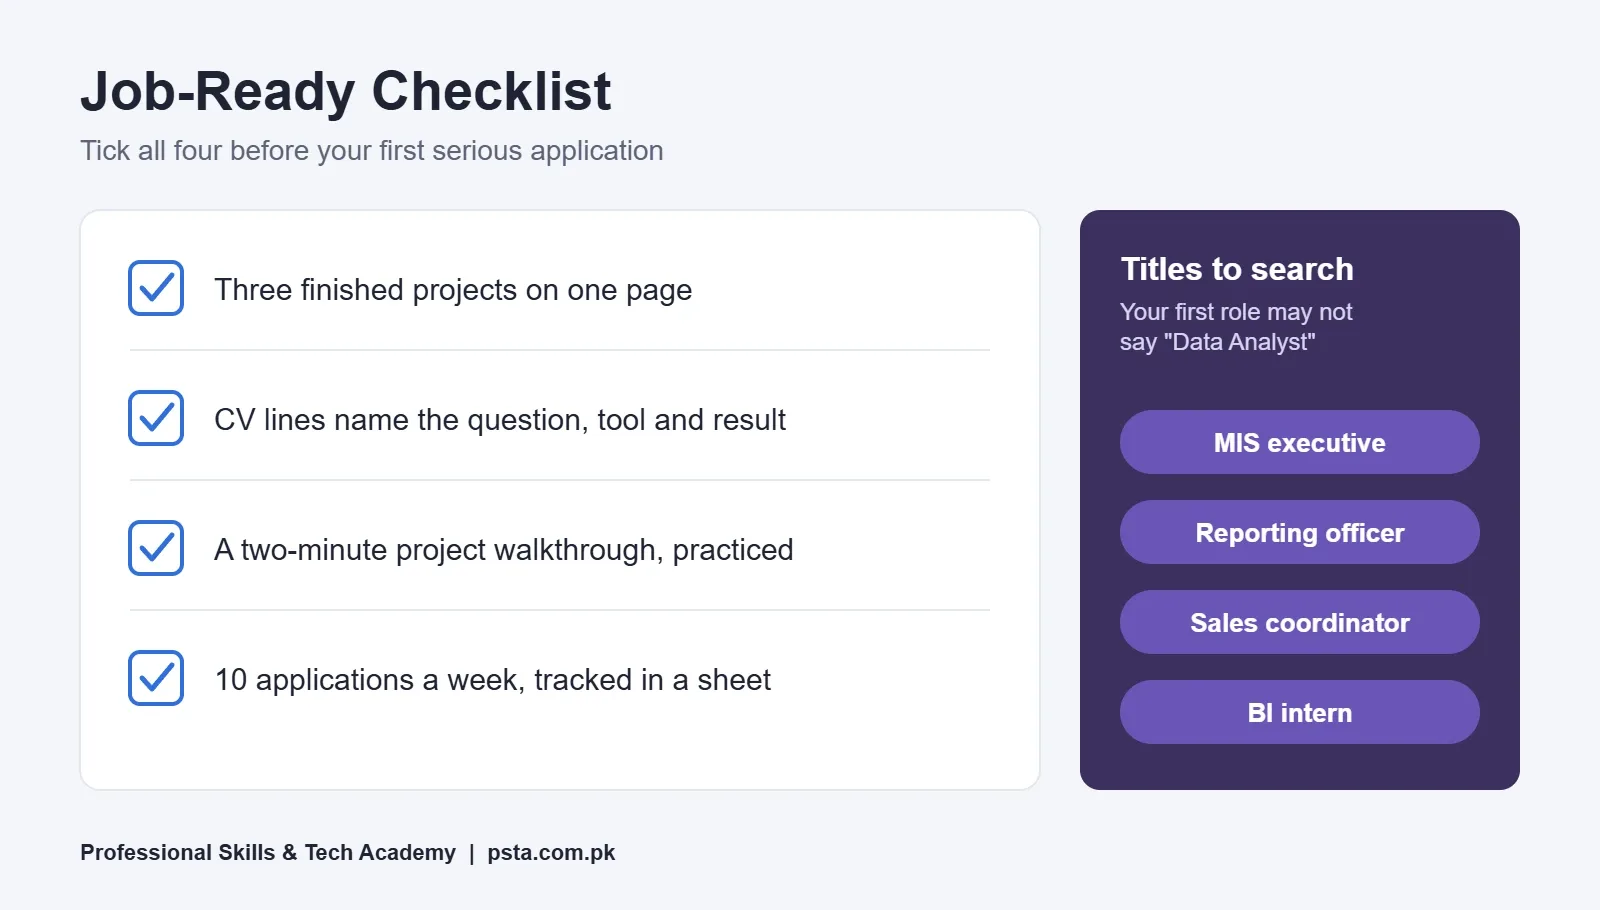
If you plan to become a data analyst in Pakistan, widen your search early. Your first analytics job may not carry the title "Data Analyst." It could be advertised as MIS executive, reporting officer, sales coordinator or business intelligence intern. Read job ads for the tools they mention, not just the title.
- Put your three projects on one simple page, with a link to each file or published report.
- Rewrite your CV so each project line names the question, the tool and the result.
- Apply to 10 suitable roles a week and keep a small tracker sheet, which is itself a mini analysis exercise.
- Prepare a two-minute explanation of one project. Expect a request such as, "Walk me through a report you built."
- Offer to improve one report at your current workplace, even unpaid. A real before-and-after is strong evidence.
Freelancing is possible later, but clients expect proof first. Treat your portfolio as the thing that makes freelance work possible, not as a shortcut around experience.
Studying the Power BI Stage With PSTA
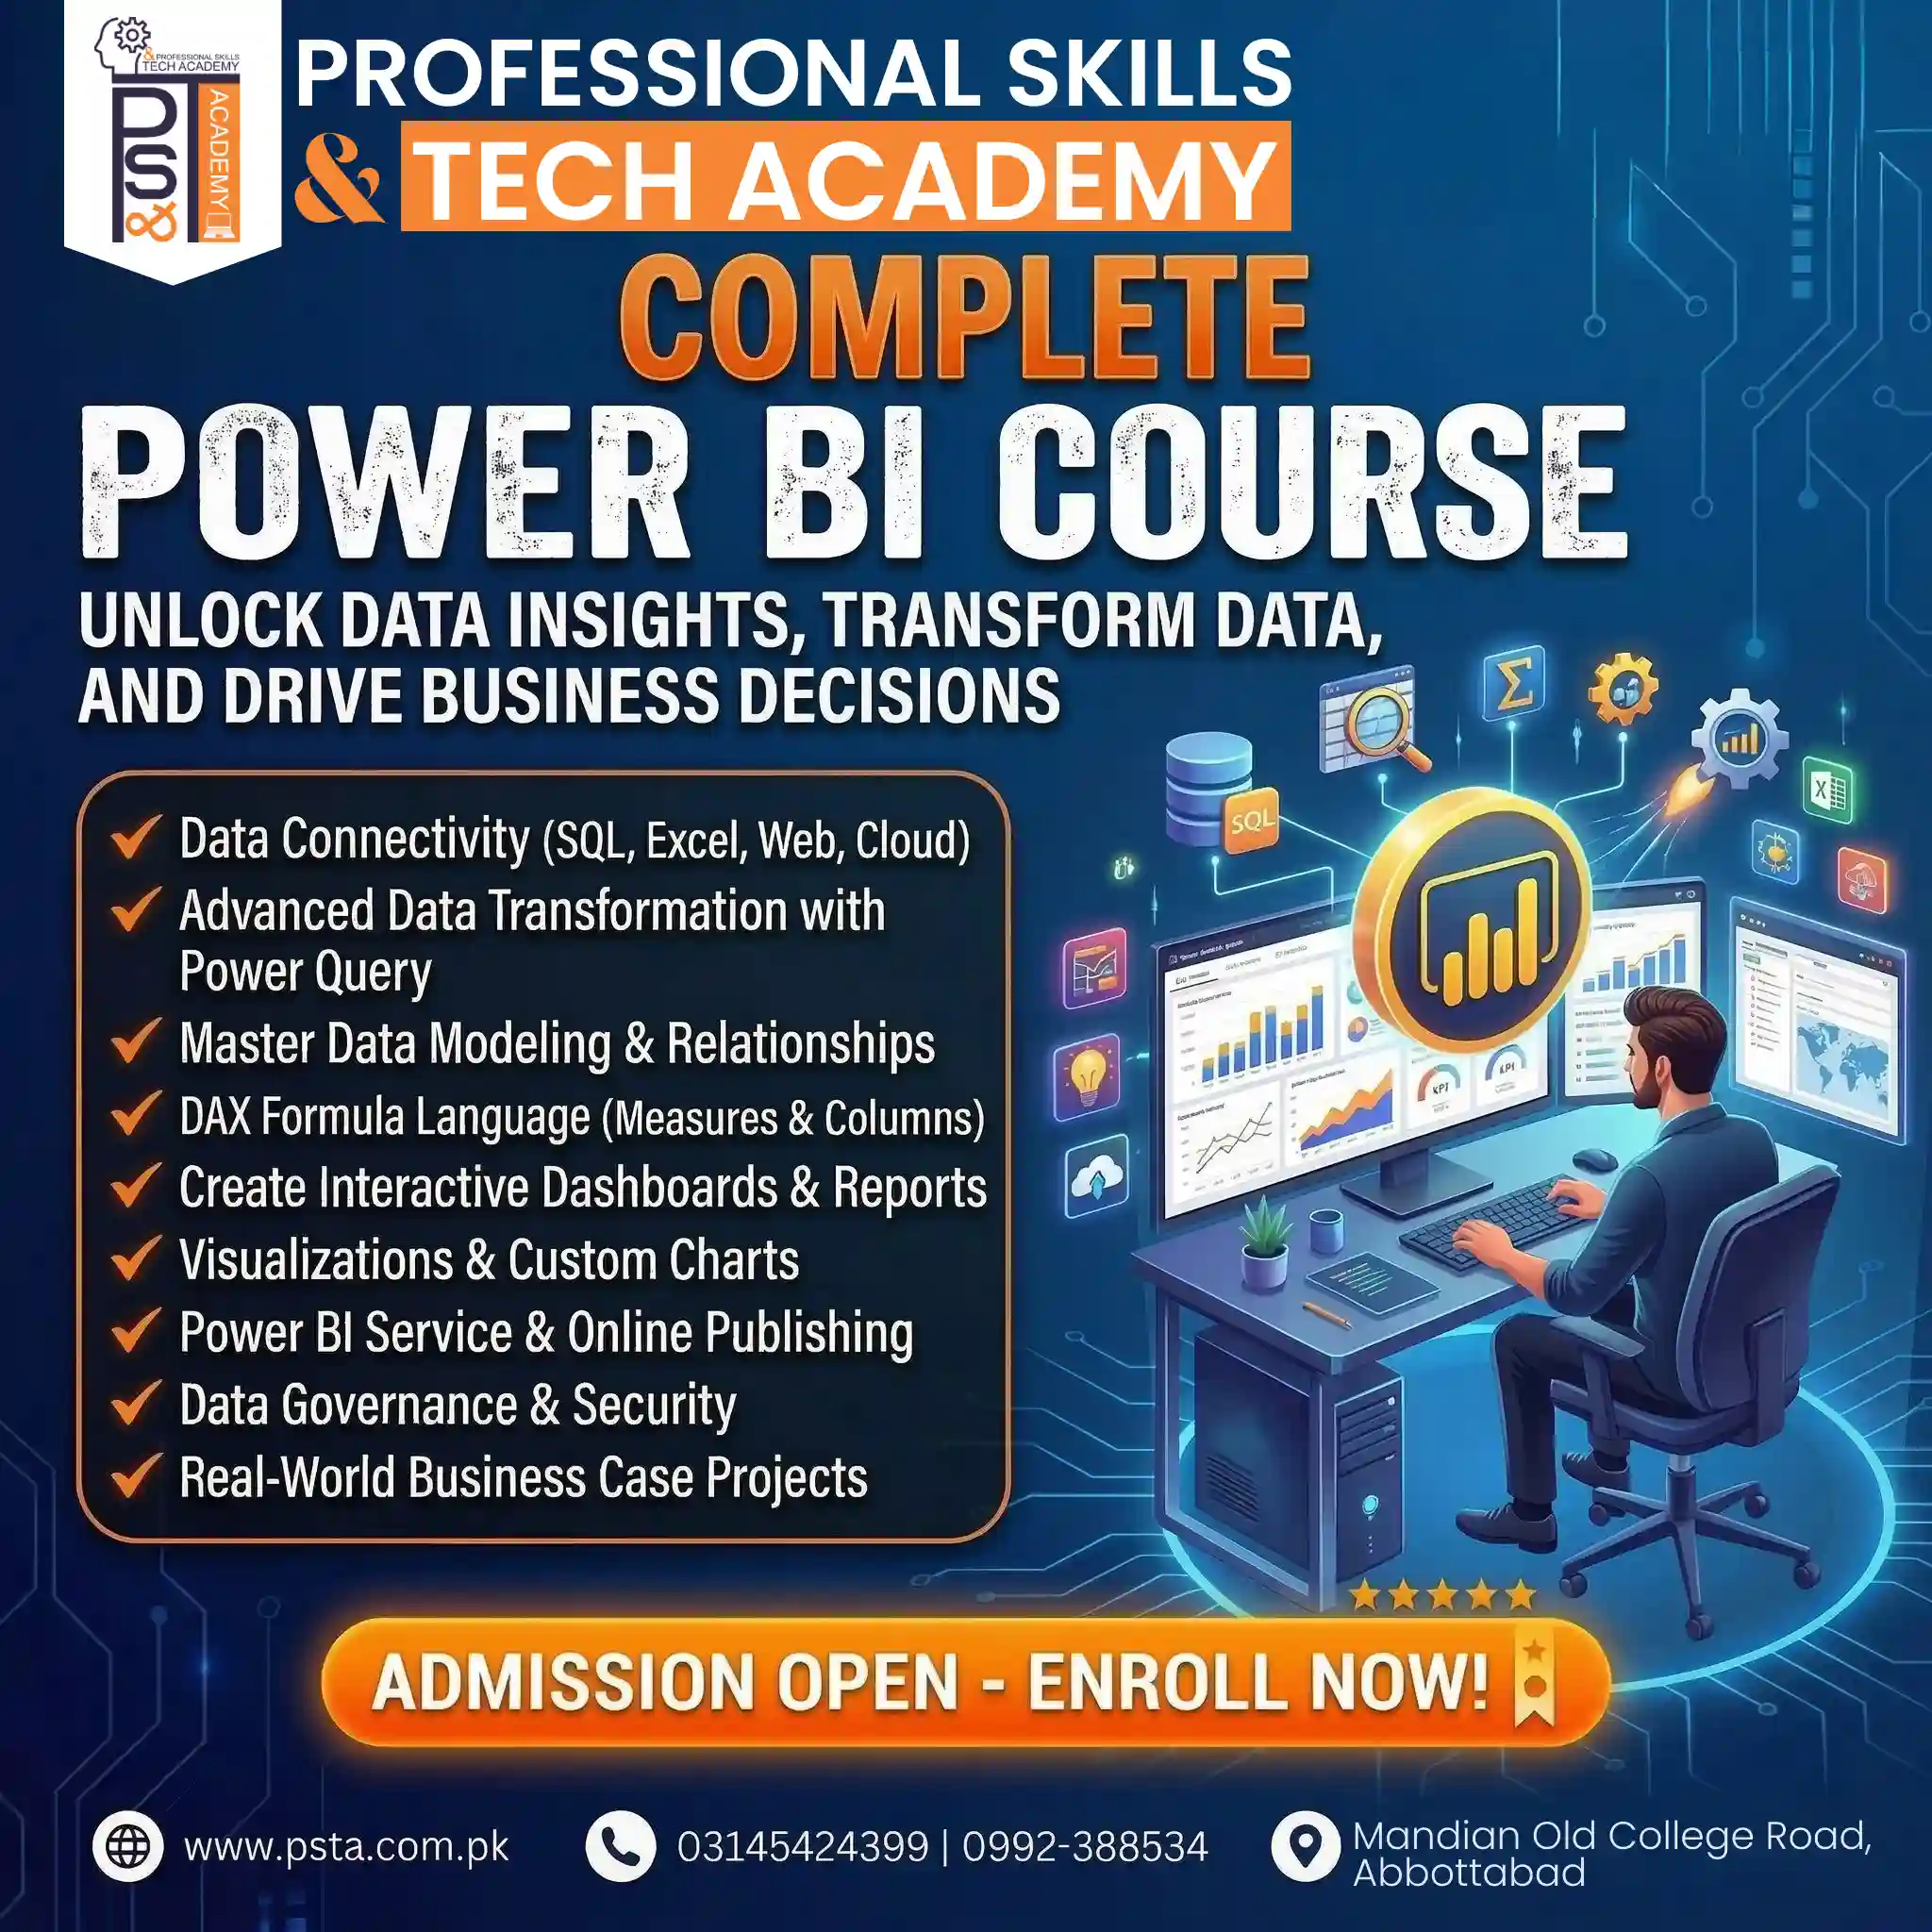
If you want guided help with Months 3 and 4, PSTA's Power BI Course: Data Analytics & Dashboards runs for 8 weeks at a beginner level. Its modules start with pulling data in from SQL, Excel, the web and the cloud, then move through Power Query, data modeling, DAX, dashboards, the Power BI service, data governance and security, and business case projects. The listed fee is Rs. 32,000 (regular Rs. 35,000), and a new batch begins each month.
Classes happen in person in Mandian (Old College Road, opposite FIMS College) and live online for learners in other cities. Students who need stronger spreadsheet basics first often start with the Office Automation course, and those ready for Month 5 can continue with Advanced Python. Compare everything on the courses page, or message +92 314 5424399 on WhatsApp to ask about class timings.
Applying is done through our short online admission page, whenever it suits you. There's no pressure to join; the roadmap above works with self-study too.
Pick Your Practice Dataset Tonight
Don't wait until you feel ready. Tonight, choose one dataset you'll use for all of Month 1. It could be your family's monthly expenses, a shop's sales register or a public table from a government website. Open it in Excel, write down three questions it could answer and save the file in a synced folder. That small step turns this data analyst roadmap from something you read into something you're doing.
Frequently asked questions
Can I become a data analyst without a computer science degree?
Yes. Analyst work depends more on what you can show than on your degree title. Commerce, economics, statistics and even arts graduates move into reporting roles when they can clean data in Excel, write basic SQL and build a clear Power BI report. Some employers do filter by degree, so let your portfolio and a short project summary carry the weight on your CV.
How long does it take to become a data analyst in Pakistan?
With 8 to 10 hours of study a week, most beginners can cover Excel, SQL and Power BI in about four months and finish a small portfolio by month six. Someone already using Excel at work may need less time. Getting hired can take longer, so keep applying and improving your projects while you search.
Should I learn Power BI or Python first?
Learn Power BI first if your goal is a reporting or business intelligence job in Pakistan, because it builds directly on the Excel skills you already have. Python is worth adding once you are comfortable with tables, joins and measures. It helps with combining many files, cleaning text and repeatable analysis, but it is not the fastest route to a first role.
Is Excel still enough for data analyst jobs?
Excel alone can get you a junior MIS or reporting post, but it limits your growth. To grow beyond that, you will want SQL and a dashboard tool such as Power BI. Treat Excel as your foundation, not the finish line. Strong Excel skills make SQL and Power BI much easier to learn later.
Can I learn Power BI on a Mac?
Power BI Desktop runs on Windows only, according to Microsoft. On a Mac, you can install Windows in a virtual machine, use a separate Windows PC for practice or view and lightly edit reports in the Power BI web service. For serious learning, a Windows laptop with 8 GB of RAM is the simplest setup.
How much does the PL-300 exam cost in Pakistan?
Microsoft does not publish one fixed global price. Its certification page says the fee depends on the country where the exam is proctored, and you see the exact amount when you schedule through Pearson VUE. Check that screen before you budget. Use the free practice assessment first so you only pay once you are scoring well.
Can I freelance as a data analyst while I am still learning?
You can, but start small and honest. Offer simple tasks such as cleaning a spreadsheet or building a one-page sales report for a local shop, and show your portfolio instead of claiming experience you do not have. Larger dashboard projects usually come after you have a few finished samples and at least one satisfied client.
Sources & references
- Future of Jobs Report 2025: Jobs Outlook (World Economic Forum) weforum.org
- Future of Jobs Report 2025: Skills Outlook (World Economic Forum) weforum.org
- IT exports hit record $4.6b (The Express Tribune) tribune.com.pk
- Get Power BI Desktop (Microsoft Learn) learn.microsoft.com
- Microsoft Certified: Power BI Data Analyst Associate (Microsoft Learn) learn.microsoft.com
- Study guide for Exam PL-300 (Microsoft Learn) learn.microsoft.com
Last reviewed & updated on by Umar Qureshi. Written by the PSTA team in Abbottabad, Pakistan.

Umar Qureshi
Power BI Course: Data Analytics & Dashboards
Turn this guide into a career: hands-on training with real projects, online across Pakistan or on-campus in Abbottabad · 8 Weeks.
Comments
No comments yet — ask a question or share your experience.