Quick answer
Learn Power BI first if you use Windows and want jobs at offices that run Microsoft 365. Choose Tableau first if you own a Mac or want a free public portfolio on Tableau Public. Power BI Desktop is a free Windows download, and Tableau offers free Public and Free desktop editions. Skills transfer, so add the second tool later.
Key takeaways
- • Power BI Desktop is a free download but runs only on Windows 10 or later.
- • Tableau Desktop runs on Windows and macOS, with free Public and Free editions.
- • Anything published to Tableau Public is visible to anyone, so use open data there.
- • Power BI Pro lists at $14 per user/month; Tableau Standard starts at $15, billed annually.
- • Count 20 local job ads to see which tool your target employers actually name.
- • Learn one tool well, then rebuild a finished project in the other.
Table of contents 17 sections
- Who Makes Each Tool, and How Do Analysts Rate Them?
- Power BI vs Tableau at a Glance
- What Can You Use for Free as a Student?
- Power BI's Free Options
- Tableau's Free Options
- Will Your Laptop Run It?
- How Different Is the Learning Curve?
- Cleaning Data
- Writing Calculations
- Building Visuals
- What Do Companies Pay for Licenses?
- Which One Do Employers in Pakistan Ask For?
- Power BI or Tableau: Which Should You Learn First?
- How Do You Add the Second Tool Without Starting Over?
- Common Mistakes When Choosing Between Them
- Where PSTA's 8-Week Power BI Course Fits
- Rebuild One Chart in Both Tools Tonight
For most beginners in Pakistan, the Power BI vs Tableau decision comes down to two plain facts: the laptop you own and the kind of company you want to work for. If you have a Windows laptop and you're aiming at offices that already run Microsoft 365, start with Power BI. If you're on a Mac, or you want a public portfolio that anyone can open in a browser, Tableau gets you moving faster.
That's the rule I give students who ask this in class, and it holds up better than any feature checklist. Both tools build the same kind of interactive dashboard. Both appear in data analyst job ads. What separates them for a learner is cost, hardware and where your first employer stores its data.
By the end of this comparison, you'll be able to answer:
- What each tool lets you do for free, and where the free versions stop
- Whether your current laptop can run Power BI Desktop or Tableau Desktop
- How the learning curve differs, from cleaning data to writing calculations
- What companies pay for licenses, in US dollars, from the official price pages
- Which tool to learn first, and how to add the second without starting over
Who Makes Each Tool, and How Do Analysts Rate Them?
Power BI is Microsoft's business intelligence tool. It has two main parts you'll meet as a learner: Power BI Desktop, a Windows program where you build reports, and the Power BI service, the website where reports are published and shared. It sits inside the same family as Excel, Teams and SharePoint, which matters a lot in offices that already pay for Microsoft 365.
Tableau is owned by Salesforce. You build visualizations in Tableau Desktop and share them through Tableau Cloud, Tableau Server or, for public work, Tableau Public. Tableau built its name on drag-and-drop visual exploration, and many analysts still say it feels more natural for sketching charts quickly.
Neither tool is a niche choice. Microsoft says it was named a Leader in the 2025 Gartner Magic Quadrant for Analytics and BI Platforms for the 18th consecutive year. Tableau says it was named a Leader in the 2026 edition of the same report for the 14th time. So you're choosing between two mature, widely used business intelligence tools, not betting on an unknown.
Power BI vs Tableau at a Glance
Here's the side-by-side view. Every row comes from the vendors' own documentation and price pages, linked in the sections below.
| Point of comparison | Power BI | Tableau |
|---|---|---|
| Owner | Microsoft | Salesforce |
| Free desktop app | Power BI Desktop (free download) | Tableau Desktop Public Edition and Free Edition |
| Desktop operating systems | Windows 10 or later (no macOS version) | Windows 8/8.1, 10, 11 and recent macOS versions |
| Minimum memory | 2 GB available, 4 GB or more recommended | 4 GB minimum, 16 GB recommended |
| Free public sharing | Not built in; the service needs a work or school email | Tableau Public, where published work is visible to anyone |
| Calculation language | DAX, plus M in Power Query | Tableau calculated fields and LOD expressions |
| Entry paid price | Pro at $14 per user/month, paid yearly | Standard from $15 per user/month, billed annually |
| Update rhythm | New Desktop version every month | Numbered releases, such as 2026.1 |
What Can You Use for Free as a Student?
This is where most confusion starts, because both companies have changed their free options over the years.
Power BI's Free Options
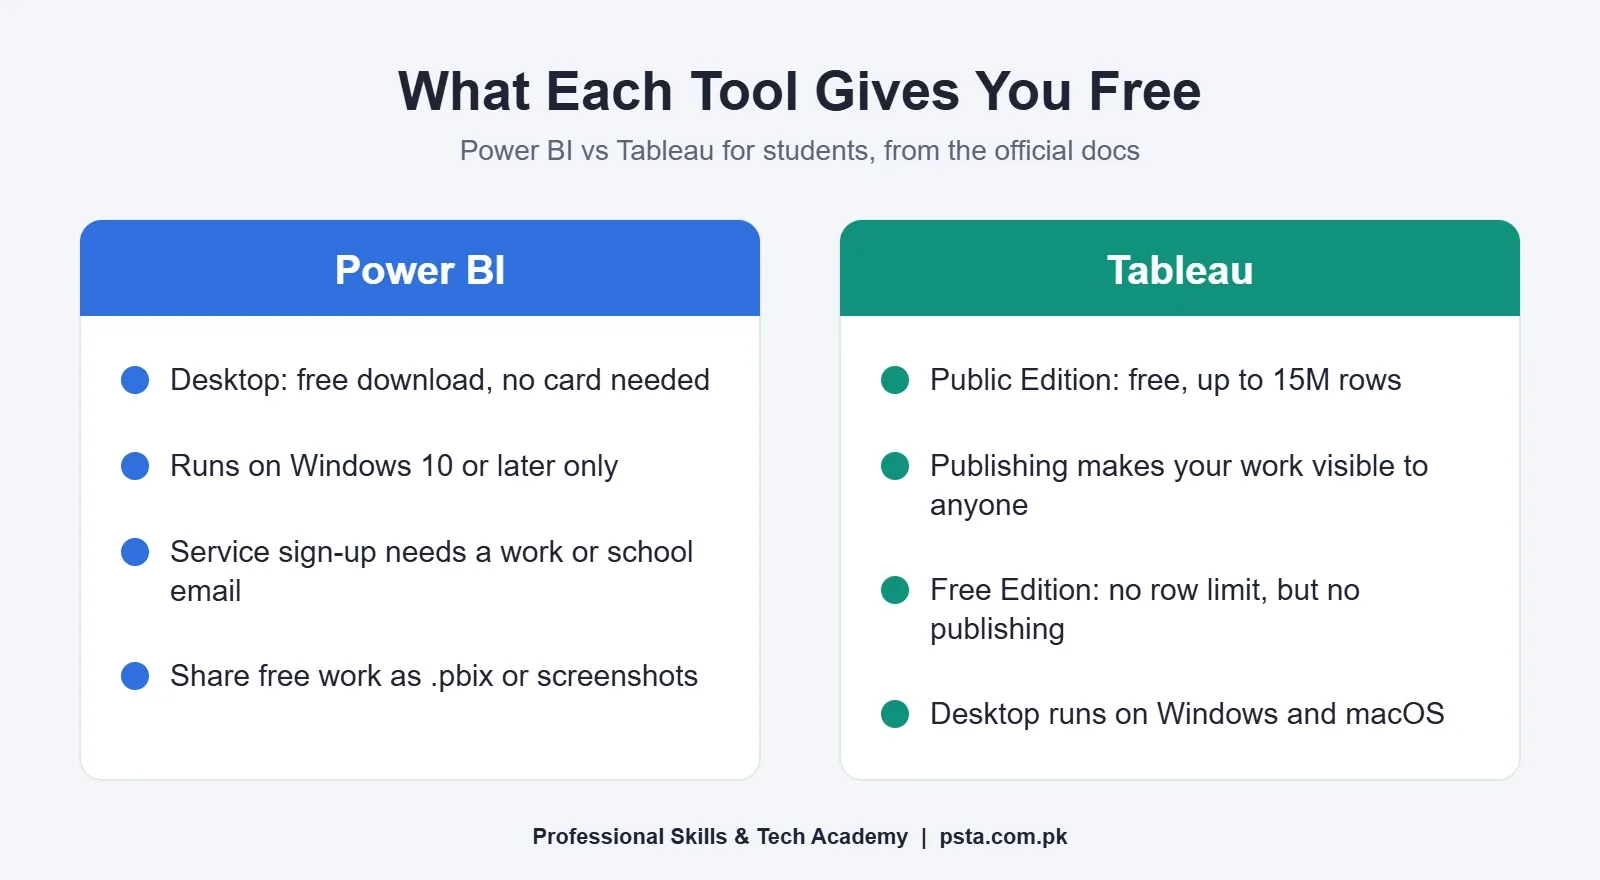
Microsoft's Power BI pricing page lists a free account and says Power BI Desktop is a free download with no credit card required. You can learn almost every core skill in Desktop alone: importing data, Power Query, relationships, DAX measures and report design.
The catch is sharing. Microsoft's sign-up documentation says you need a work or school email for the Power BI service, and consumer addresses like Gmail or Hotmail can't be used directly. Its suggested workaround is a Microsoft 365 trial, which creates a work account for you. In practice, many students share Power BI work as screenshots, short screen recordings or the .pbix file itself.
Tableau's Free Options
Tableau now has two free desktop editions, and they behave very differently. According to Tableau's edition comparison:
- Tableau Desktop Public Edition analyzes up to 15 million rows, connects to a limited set of sources such as Excel, text files, JSON, PDF and Google Drive, and publishes to Tableau Public.
- Tableau Desktop Free Edition has no row limit and connects to most sources, but it can't publish to Tableau Public, Tableau Cloud or Tableau Server. It's meant for private work on your own machine.
Tableau's Tableau Public help page is blunt about privacy: anything you publish there is not private and anyone can access it. That's perfect for a portfolio built on open data. It's a serious mistake for a client's sales file or a company's payroll.
Will Your Laptop Run It?
Hardware settles the Power BI vs Tableau question for more Pakistani students than any feature does.
Microsoft's Power BI Desktop requirements ask for Windows 10 or Windows Server 2016 or later, at least 2 GB of available RAM (4 GB or more recommended), a 64-bit processor and a screen of at least 1440x900 or 1600x900. Microsoft says lower resolutions such as 1024x768 and 1280x800 aren't supported, and the common 1366x768 budget screen also falls below that minimum, so parts of some dialog boxes can end up hidden. There's no macOS version. Mac users run it through a Windows virtual machine, a remote Windows PC or the browser-based service, which can't do everything Desktop does.
Tableau's technical specifications list Windows 8/8.1, 10 and 11, plus macOS Ventura, Sonoma, Sequoia and Tahoe (Tahoe needs Tableau 2026.1 or newer). The minimum is a dual-core Core i3 or Ryzen 3 with 4 GB of memory, and Tableau recommends a quad-core chip with 16 GB.
A quick reality check for the common laptops we see in class:
- Used Core i5 with 8 GB RAM and Windows 10 or 11: runs both tools comfortably for course-sized datasets.
- MacBook Air or Pro: Tableau installs natively. Power BI needs a workaround, so factor that in before you buy a course.
- 4 GB machine with a 1366x768 screen: both will open, but you'll fight slowdowns and cramped panels. An external monitor helps more than you'd expect.
How Different Is the Learning Curve?
The two tools split the work in a similar way: get data in, clean it, model it, calculate, then visualize. Where they differ is how much each step asks of you.
Cleaning Data
Power BI uses Power Query, the same engine that sits inside Excel. If you've already used it in a spreadsheet, the skills carry straight over, and our Power Query guide covers the steps you'll use most. Tableau handles light cleaning inside Desktop and heavier work in Tableau Prep, a separate app included with its paid plans.
Writing Calculations
This is the biggest gap. Power BI's formula language, DAX, looks like Excel formulas but behaves differently, because every result depends on filter context. Most learners hit a wall around measures like running totals or year-over-year growth. Our DAX walkthrough exists because that wall is so common.
Tableau's calculated fields feel lighter at first. You can build many useful charts with almost no formulas. The harder concept arrives later with level of detail (LOD) expressions, which control the grain a number is calculated at. Both tools reward people who understand data modeling, so neither is truly "no code" once the questions get serious.
Building Visuals
Tableau is famous for exploration: drag a field onto rows, another onto columns, and a chart appears. Power BI is more report-shaped. You place visuals on a canvas and wire them together with slicers and cross-filtering. New learners often produce a nicer-looking first chart in Tableau and a more complete first report in Power BI.
What Do Companies Pay for Licenses?
As a learner you won't pay for either, but license cost shapes which tool your future employer picks.
On Microsoft's pricing page, Power BI Pro costs $14 per user per month and Premium Per User costs $24, both paid yearly. Pro is also included in Microsoft 365 E5 and Office 365 E5. That last detail explains a lot: a company already paying for those suites gets Power BI without a separate purchase decision.
Tableau's pricing page shows Tableau Standard starting at $15 per user per month and Tableau Enterprise starting at $35, both billed annually on an annual contract, with no monthly plans. Licenses are split into Creator, Explorer and Viewer roles, and the people who build dashboards need the Creator role, which isn't the cheapest seat.
For a small Pakistani business with ten staff who mainly view reports, those annual dollar contracts are a real cost once converted to rupees. So it's reasonable to expect Power BI in offices that already pay for Microsoft 365, and Tableau where a team already uses Salesforce products or has a budget set aside for a dedicated analytics platform.
Which One Do Employers in Pakistan Ask For?
I won't give you an invented percentage here, because job-board counts change every week and no public source tracks this reliably for Pakistan. You can measure it yourself in 15 minutes, and the result will be more current than anything in a blog post.
- Search Rozee.pk and LinkedIn Jobs for "data analyst" in your city or in remote roles.
- Open the first 20 ads and note whether each one names Power BI, Tableau, both or neither.
- Repeat for "MIS executive" and "business analyst", since many reporting jobs use those titles.
- Note which other skills appear next to each tool: SQL, Excel, Python or a specific industry.
Pay attention to the employer type behind each ad, not only the tool name. A bank, a telecom company and a small export business can all hire "data analysts" while using completely different software. Your own count, filtered to the companies you'd actually apply to, is the evidence that should decide this.
If freelancing is your goal, check Upwork and Fiverr listings the same way. Clients often name the tool they already pay for, so learning one well and the other to a working level widens the jobs you can bid on.
Power BI or Tableau: Which Should You Learn First?
Follow the decision path below. It reflects the facts above, not a preference for either company.
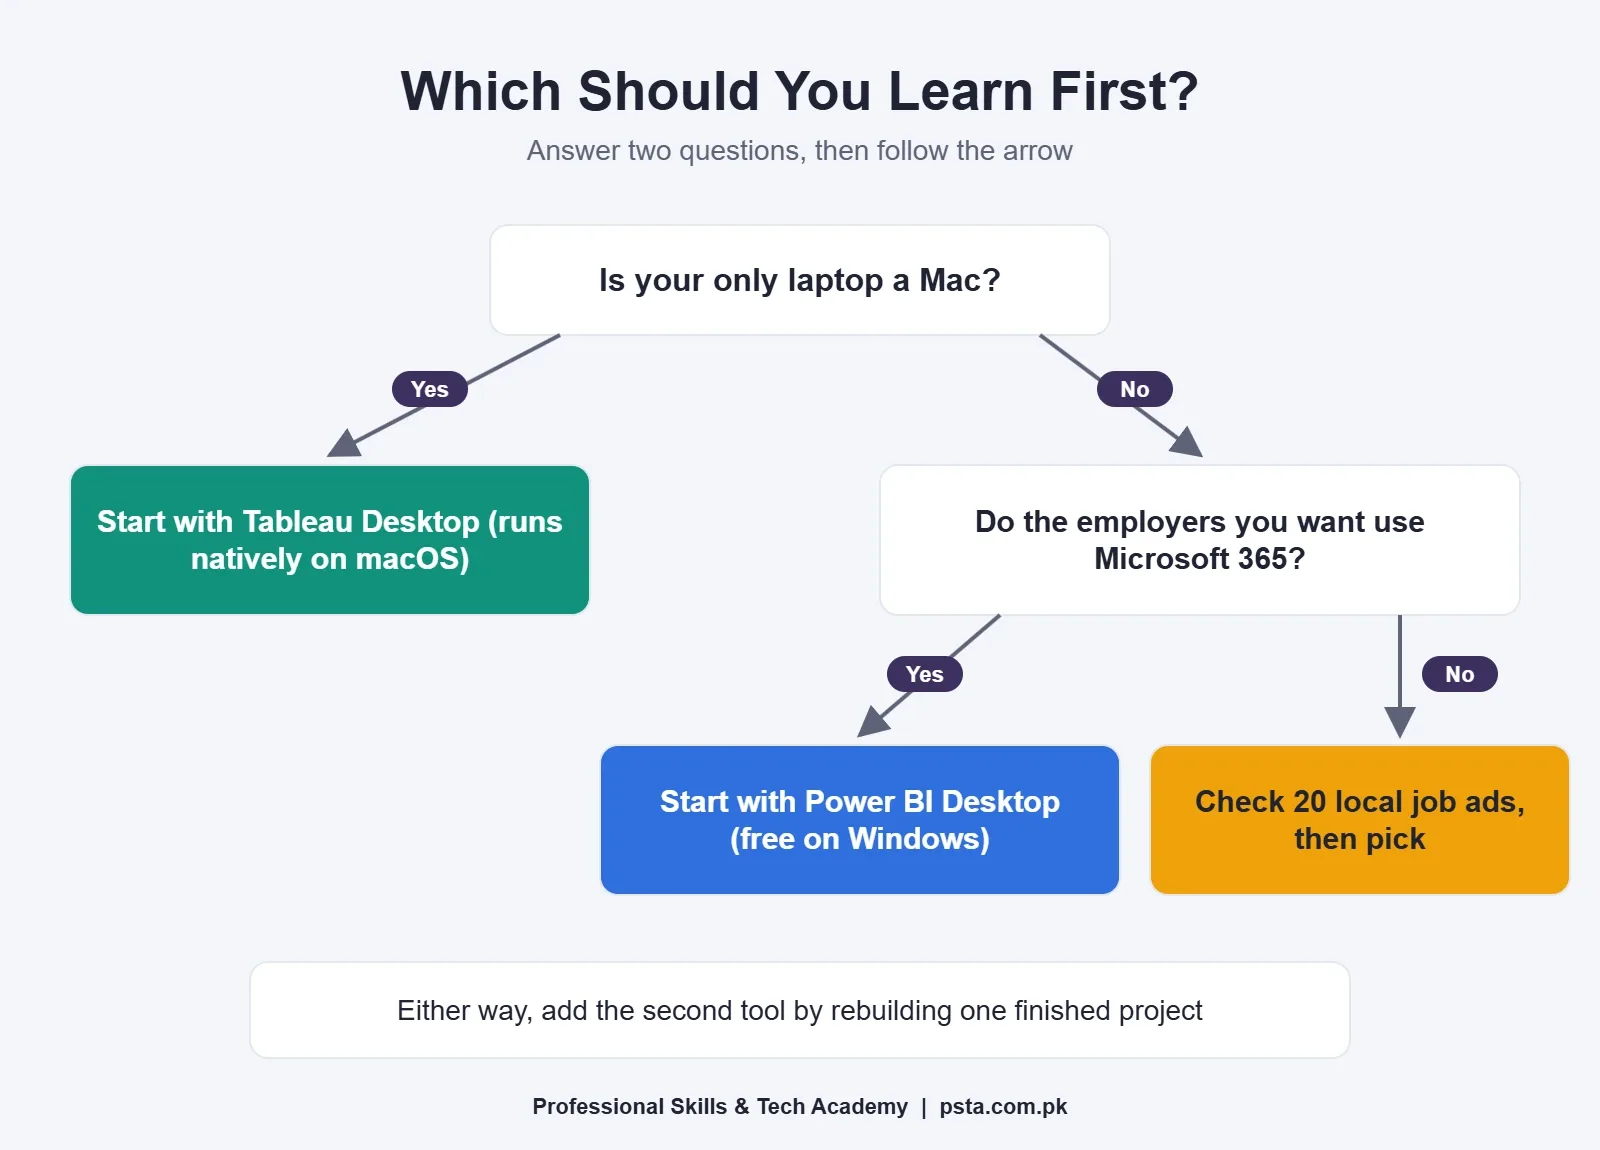
For the typical student we teach in Abbottabad, the path ends at Power BI first. Many have Windows laptops, already know some Excel, and are applying to local companies, banks, NGOs and government projects that run Microsoft software. Power Query and the data modeling habits you build there also make Tableau easier later.
Pick Tableau first if you own a Mac and don't want to run Windows alongside it, if you want a public portfolio link with zero setup, or if a specific employer you're targeting lists Tableau in its ads.
How Do You Add the Second Tool Without Starting Over?
The skills that transfer are bigger than the skills that don't. Clean data, a sensible star schema, clear KPI definitions and good chart choices work the same in both tools. What changes is the button you press and the formula syntax.
The fastest method is to rebuild a dashboard you've already finished. Take one Power BI project, export the cleaned tables to CSV or Excel, and rebuild the same report in Tableau Public. You already know what the numbers should be, so every difference you see is a lesson in how the second tool thinks. Our list of Power BI project ideas with Pakistani data gives you good starting datasets for this.
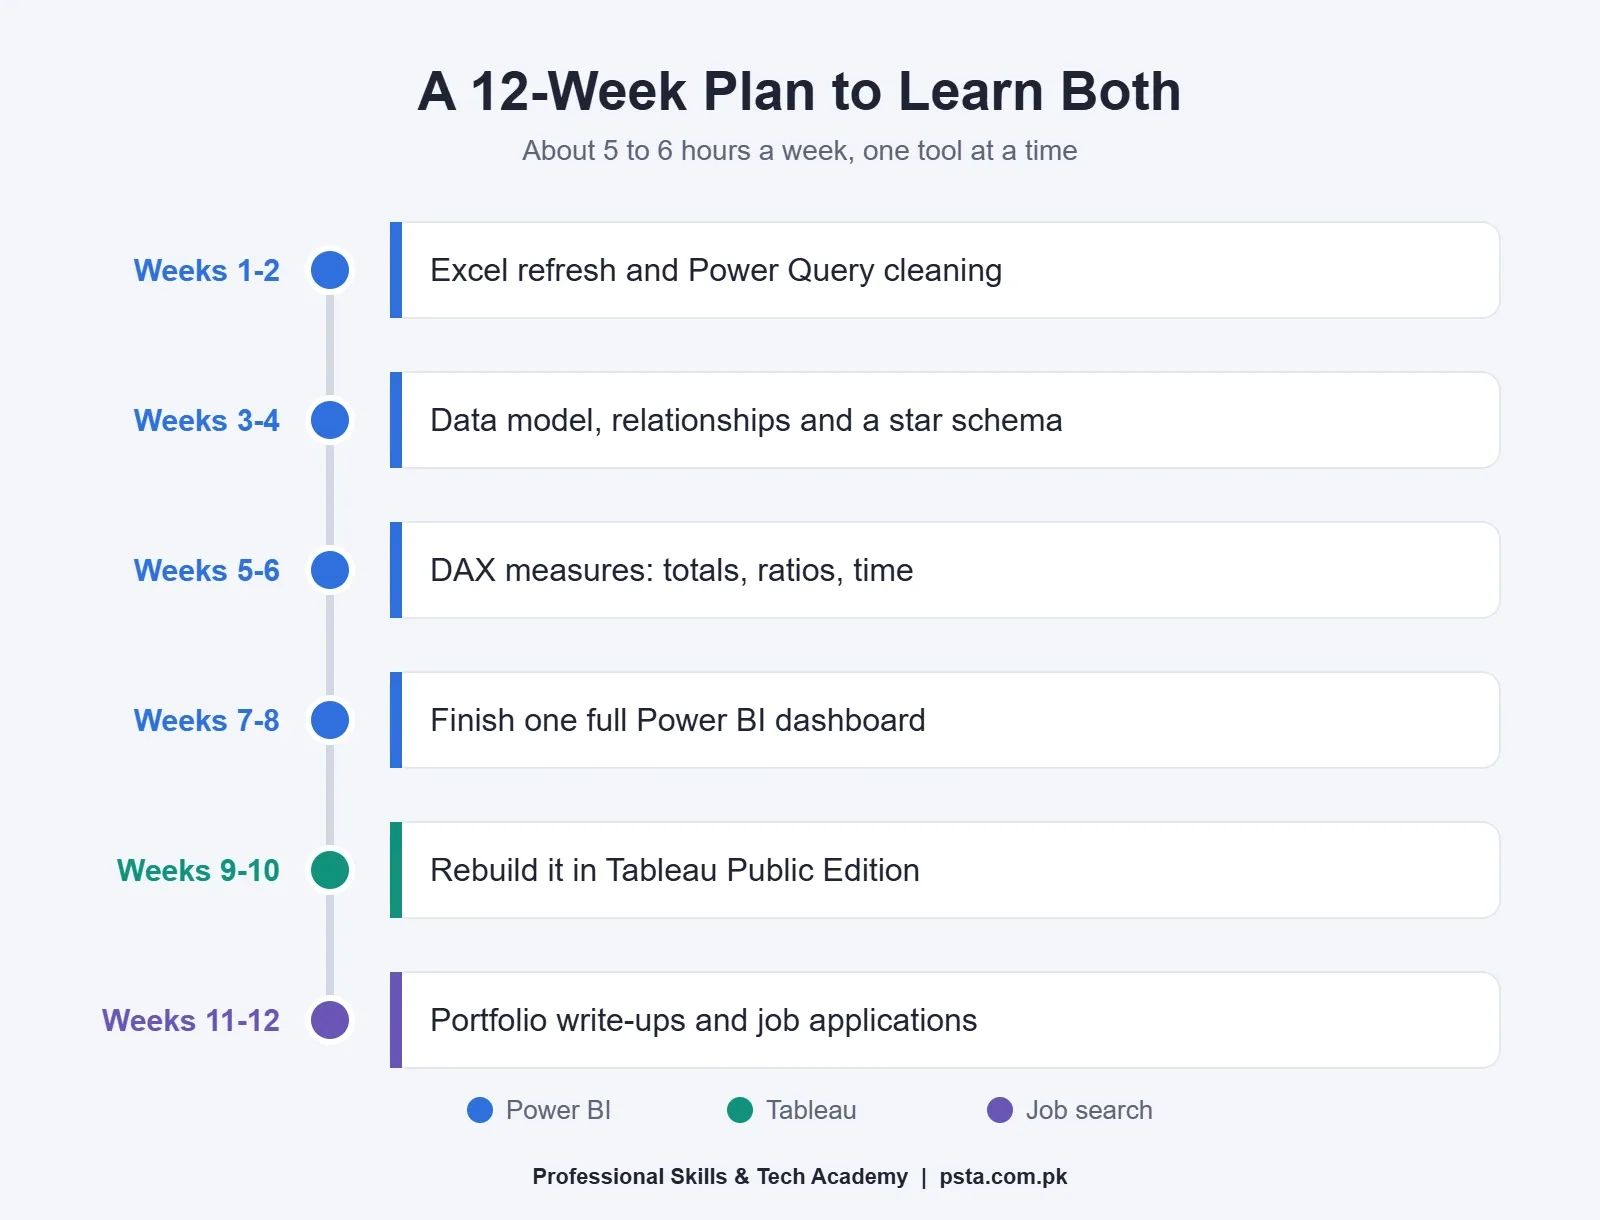
Keep the plan honest. Twelve weeks at five or six hours a week is a realistic pace for finishing solid projects in one tool and getting comfortable in the second. Rushing both at once usually leaves you shaky in each.
Common Mistakes When Choosing Between Them
- Choosing by YouTube popularity. Views tell you what's entertaining to watch, not what your local employers use.
- Publishing private data to Tableau Public. Use open datasets or made-up sample data for anything you post there.
- Skipping Excel. Both tools assume you understand tables, data types and basic formulas. Our Power BI vs Excel comparison explains why Excel comes first.
- Ignoring SQL. Real company data rarely arrives as a tidy spreadsheet. A little SQL makes you useful in either tool.
- Collecting certificates before projects. A certificate helps, and our PL-300 guide explains the Microsoft exam, but a portfolio with two or three finished dashboards answers an interviewer's real question.
Where PSTA's 8-Week Power BI Course Fits
At PSTA we teach Power BI as the first BI tool, for the laptop and job-market reasons covered above. The Power BI Course: Data Analytics & Dashboards is a beginner-level, 8-week program. Its modules cover data connectivity (SQL, Excel, web and cloud), Power Query transformation, data modeling and relationships, DAX measures and columns, interactive dashboards, the Power BI service and publishing, data governance and security, and real business case projects.
The course page lists the fee as Rs. 32,000, reduced from Rs. 35,000, at the time of writing. Classes run in person at our Abbottabad centre (Mandian, facing FIMS College on Old College Road) and live online, so a student in Karachi can sit in the same batch as one in Abbottabad. Batches start monthly, with class slots offered between 9:00 AM and 9:30 PM, Monday to Saturday.
If you want to strengthen the data side first, the Oracle Database 19c course builds the SQL skills that BI jobs expect, and Advanced Python helps if you're heading toward data science later. You can compare durations and fees on the full course list or start the admission form when you're ready. For a quick question about batch timing, message us on WhatsApp at +92 314 5424399.
Rebuild One Chart in Both Tools Tonight
Before you commit weeks to either tool, spend one evening with both. Download any small open dataset, such as monthly sales or city temperatures, and make the same bar chart in Power BI Desktop and in Tableau Desktop Public Edition. Notice which one felt clearer to you and which one your laptop handled better. That single hour will tell you more about the Power BI vs Tableau choice than another week of reading opinions.
Frequently asked questions
Is Power BI easier to learn than Tableau?
For a first chart, many beginners find Tableau quicker because you drag fields onto rows and columns and a chart appears. Power BI feels easier if you already know Excel, since Power Query works the same way in both. The hardest part of Power BI is DAX, while Tableau's harder topic is level of detail expressions.
Can I learn Power BI on a MacBook?
Not directly. Power BI Desktop has no macOS version and needs Windows 10 or later. Mac users usually run it inside a Windows virtual machine, connect to a remote Windows PC, or use the browser-based Power BI service, which lacks some Desktop features. If you only own a Mac, Tableau Desktop installs natively.
Is Tableau free for students?
Yes, in two ways. Tableau Desktop Public Edition is free and publishes to Tableau Public, where your work is visible to anyone, with analysis up to 15 million rows. Tableau Desktop Free Edition is also free, with no row limit, but it cannot publish or share online. Paid plans start at $15 per user per month, billed annually.
Do I need a work email to use Power BI?
You need a work or school email only for the online Power BI service, where reports are published and shared. Microsoft says consumer addresses such as Gmail or Hotmail can't be used directly. Power BI Desktop, where you build reports, is a free download, so you can learn most skills without signing up for the service.
Which tool do employers in Pakistan ask for more?
It depends on the employer's existing software, and job-board counts change weekly. The reliable way to find out is to open 20 current data analyst, MIS and business analyst ads on Rozee.pk or LinkedIn and note which tool each names. Offices that already pay for Microsoft 365 often lean toward Power BI.
Can I put both Power BI and Tableau on my CV?
Yes, if you can show real work in each. List the tool you know best first and link a finished dashboard. For the second tool, a rebuilt version of the same project is honest proof of a working level. Avoid listing a tool you have only watched videos about, because interviewers usually ask you to explain a dashboard you made.
How long does it take to learn Power BI and Tableau?
At five or six hours a week, eight weeks is a sensible target for building one complete Power BI dashboard, including Power Query, a data model and DAX measures. Another two weeks lets you rebuild that dashboard in Tableau Public, and two more go to portfolio write-ups and applications. Your pace will depend on your Excel and SQL background.
Sources & references
- Power BI pricing microsoft.com
- Get Power BI Desktop (requirements) learn.microsoft.com
- Sign up for the Power BI service as an individual learn.microsoft.com
- Tableau pricing tableau.com
- Tableau Desktop Public, Free and Professional Edition comparison help.tableau.com
- Tableau technical specifications tableau.com
- Save workbooks with Tableau Public help.tableau.com
- Microsoft named a Leader in the 2025 Gartner Magic Quadrant for ABI Platforms community.fabric.microsoft.com
Last reviewed & updated on by Umar Qureshi. Written by the PSTA team in Abbottabad, Pakistan.

Umar Qureshi

Power BI Course: Data Analytics & Dashboards
Turn this guide into a career: hands-on training with real projects, online across Pakistan or on-campus in Abbottabad · 8 Weeks.


Comments
No comments yet — ask a question or share your experience.