Quick answer
Pandas is a free Python library for cleaning and summarizing tables. Start by loading your file with read_excel and checking it with info(). Then remove duplicates, convert text prices and dates carefully, decide what blank cells mean, and answer questions with groupby or pivot_table. You need Python 3.11 or newer, or Google Colab.
Key takeaways
- • Always inspect with info() before changing anything; it shows text columns and gaps at once.
- • Parse each date format separately; a single mixed parse can silently swap day and month.
- • Filling blanks is a business decision, so confirm what a gap means before using fillna.
- • groupby and pivot_table turn a clean table into answers in one line each.
- • Pandas 3.0 made str the default text type and stopped chained assignment from working.
Table of contents 18 sections
- What Is Pandas, and When Is It Worth Learning?
- What Do You Need Before You Start?
- The Example Scenario: A Shop's Messy Sales Export
- Pandas for Beginners: The Seven-Step Cleaning Walkthrough
- Step 1: Load the File and Look Before You Touch It
- Step 2: Remove Duplicate Rows
- Step 3: Turn "Rs. 1,200" Into a Number
- Step 4: Fix Mixed Dates Without Swapping Day and Month
- Step 5: Clean City Names
- Step 6: Decide What Missing Quantities Mean
- Step 7: Save a Clean Copy and a Summary
- What the Cleaned Data Tells the Owner
- What Changed in Pandas 3.0, and Does It Affect You?
- The 12 Pandas Methods to Learn First
- Pandas for Beginners: Mistakes to Avoid With Messy Data
- Pandas, Excel or Power BI: Which Tool for Which Task?
- Learning Pandas Step by Step at PSTA
- Your Weekend Exercise: Clean One Real Sheet
Try this quick self-test before you read on. Open the last sales or fee sheet you handled and ask three questions. Does the same order appear twice? Are some amounts typed as text, like "Rs. 1,200"? Do the dates follow two different formats? If you answered yes even once, pandas for beginners is the right next step for you, because pandas is the Python library built for exactly this kind of cleanup.
In this pandas for beginners guide, we clean one small, realistic sales export from start to finish. Every line of code was run on pandas 3.1.1, the current release, so the output you see is the output you will get.
Work through it and you'll come away able to:
- Load an Excel export into pandas and inspect it before changing anything
- Remove duplicate orders and convert text prices into real numbers
- Fix mixed date formats without silently swapping days and months
- Answer a shop owner's questions with groupby and pivot_table
- Avoid the pandas 3.0 changes that break older tutorial code
What Is Pandas, and When Is It Worth Learning?
Pandas is a free, open-source Python library for working with tables. Its main object is the pandas DataFrame: rows and named columns, much like a worksheet, except every step you take is written as code. That code becomes a record you can rerun next month on a fresh export.
Python use is still growing. Of everyone who answered the 2025 developer survey run by Stack Overflow, 57.9% reported using it, 7 percentage points more than in 2024. If you want to use Python for data, pandas is the natural first library to learn.
Pandas for beginners isn't about replacing Excel. You don't need it for a one-off sheet of 40 rows. Excel handles that well. Pandas starts paying off when one of these is true:
- You repeat the same cleanup every week or month.
- The file has tens of thousands of rows and Excel slows down.
- You combine several exports, such as one file per branch.
- Someone else needs to check exactly what you changed.
What Do You Need Before You Start?
You need Python 3.11 or newer. The pandas page on PyPI lists 3.1.1 as the latest version and Python 3.11 as the minimum. The python.org downloads page shows Python 3.15.2 as the newest release, so any fresh install will be new enough.
There are two simple ways to set up:
- On your own laptop. Install Python, then open Command Prompt and run
pip install pandas openpyxl. The second package lets pandas read .xlsx files. - In your browser. Google Colab runs Python notebooks online. Its official FAQ says Colab is free and needs no setup, though free sessions run for at most 12 hours. This route suits students on a low-spec or shared computer.
If you are new to Python syntax itself, read our guide to Python lists, tuples, sets and dictionaries first. Pandas makes more sense once those feel familiar.
The Example Scenario: A Shop's Messy Sales Export
This is an example scenario built for teaching, not a real business. A mobile accessories shop sells chargers, earbuds, covers and power banks to customers in Abbottabad, Mansehra and Haripur. The owner exports three months of orders from his billing app and asks two things: which city brings the most revenue, and how sales moved month by month.
The export has 12 rows and six columns: order_id, date, city, category, price and qty. It looks fine at a glance. Look closer and you find five problems that would give the owner wrong answers.
- Two orders were exported twice.
- Prices are text, written as "Rs. 1,200" in most rows and "650" in one.
- Some dates are 03/09/2026 (day first) and others 2026-09-03.
- Abbottabad also appears as "abbottabad " with a trailing space and as "ATD".
- Two rows have no quantity.
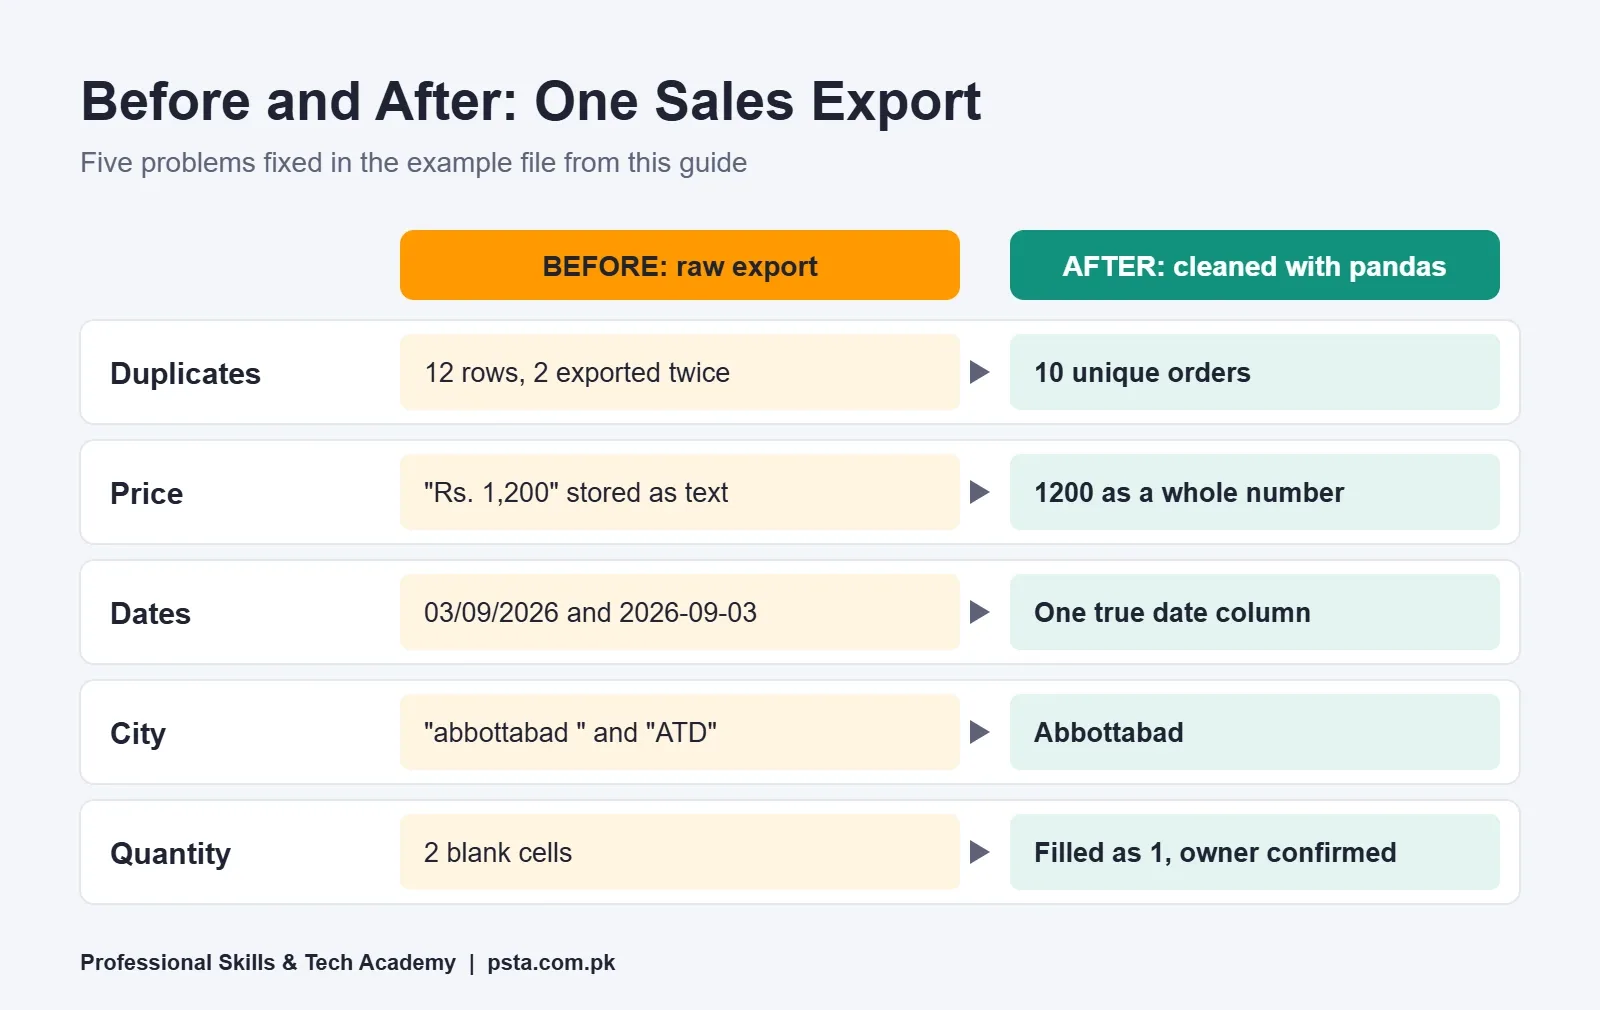
A pivot table built on this raw file would list Abbottabad under three different names and fail to add up the prices at all. That is why cleaning always comes before analysis.
Pandas for Beginners: The Seven-Step Cleaning Walkthrough
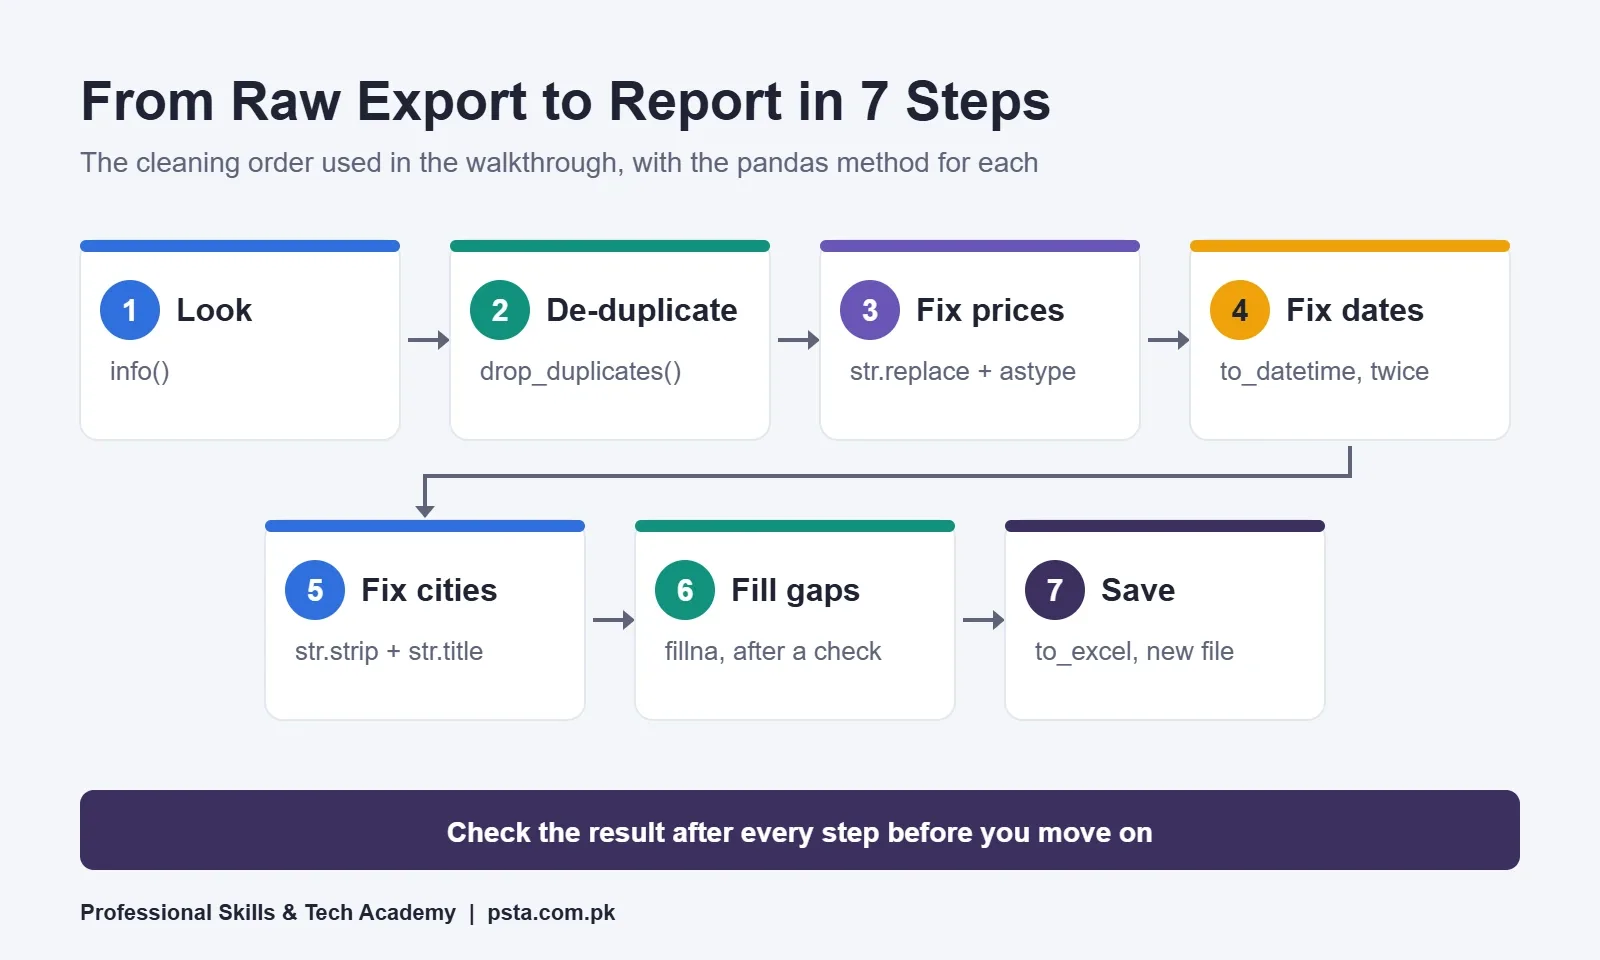
Most pandas for beginners lessons jump straight to charts. Here, you run each step in order and check the result before moving on. Python data cleaning goes wrong when you change five things at once and can't tell which change caused a problem.
Step 1: Load the File and Look Before You Touch It
import pandas as pd

df = pd.read_excel("sales.xlsx", engine="openpyxl", dtype={"order_id": str})
print(df.shape)
df.info()
print(df.head())
shape returns (12, 6): 12 rows, 6 columns. info() is the most useful first look. It shows that price is stored as str, not a number, and that qty has only 10 non-null values out of 12. Two problems found before writing a single fix. That one line is also all it takes to read Excel in Python.
Why pass engine="openpyxl"? The read_excel documentation notes that the default reader for .xlsx files will change from openpyxl to calamine in a future version. Naming the engine keeps your script behaving the same after an upgrade. The dtype argument keeps order IDs as text, so an ID like 0042 never loses its leading zeros.
Step 2: Remove Duplicate Rows
print(df.duplicated().sum())   # 2
df = df.drop_duplicates()
print(df.shape)                # (10, 6)
Count first, then drop. If the count had been 300 instead of 2, you would want to know why before deleting anything. Here, orders 1002 and 1010 were exported twice, so 10 real orders remain.
Step 3: Turn "Rs. 1,200" Into a Number
df["price"] = (
    df["price"]
    .str.replace("Rs.", "", regex=False)
    .str.replace(",", "", regex=False)
    .str.strip()
    .astype(int)
)
Each line does one small job: remove the currency label, remove the thousands comma, trim spaces, then convert to whole numbers. Setting regex=False matters, because in a regular expression the dot in "Rs." would match any character.
Step 4: Fix Mixed Dates Without Swapping Day and Month
This is the step where most beginners get a wrong answer without noticing. Our first attempt used one line with format="mixed", dayfirst=True. It ran without an error, but it read 2026-09-03 as 9 March instead of 3 September, and two September orders landed in March and May.
The safer fix is to parse each format on purpose and combine the results:
iso = pd.to_datetime(df["date"], format="%Y-%m-%d", errors="coerce")
dmy = pd.to_datetime(df["date"], format="%d/%m/%Y", errors="coerce")
df["date"] = iso.fillna(dmy)
print(df["date"].isna().sum())   # 0
With errors="coerce", a value that doesn't match becomes missing instead of crashing. fillna then takes the day-first version wherever the ISO version failed. The final count of 0 confirms that every date was understood.
Step 5: Clean City Names
df["city"] = (
    df["city"].str.strip().str.title()
    .replace({"Atd": "Abbottabad"})
)
print(df["city"].value_counts())
str.strip() removes stray spaces and str.title() fixes capitals. The short form "ATD" becomes "Atd" after title case, so the replace dictionary maps that spelling to the full name. value_counts() now shows just three cities: Abbottabad 5, Mansehra 3 and Haripur 2.
Step 6: Decide What Missing Quantities Mean
Pandas can fill gaps, but it can't tell you what a gap means. The pandas guide to missing data covers isna() to find gaps, dropna() to remove rows and fillna() to replace values. Which one is right is a business decision.
In our example, the owner confirms that a blank quantity means a single item. Only then do we fill it:
df["qty"] = df["qty"].fillna(1).astype(int)
df["revenue"] = df["price"] * df["qty"]
df["month"] = df["date"].dt.to_period("M")
Without that confirmation, the honest choice is to leave the two rows out and say so in your report.
Step 7: Save a Clean Copy and a Summary
report = df.pivot_table(index="month", columns="category",
                        values="revenue", aggfunc="sum", fill_value=0)

with pd.ExcelWriter("sales_clean.xlsx") as writer:
    df.to_excel(writer, sheet_name="clean", index=False)
    report.to_excel(writer, sheet_name="monthly")
Never overwrite the original export. Keeping the raw file and the script side by side means anyone can rerun the cleanup and get the same result.
What the Cleaned Data Tells the Owner
With clean columns, the owner's two questions take one line each. The pandas groupby user guide describes the idea as split, apply, combine: split rows into groups, run a calculation on each group, and join the answers.
df.groupby("city")["revenue"].sum().sort_values(ascending=False)| Question | Pandas code | Answer from the example data |
|---|---|---|
| Revenue by city | groupby("city")["revenue"].sum() | Abbottabad Rs. 23,900, Haripur Rs. 8,200, Mansehra Rs. 6,750 |
| Revenue by month | groupby("month")["revenue"].sum() | September Rs. 10,150, October Rs. 15,600, November (first 5 days) Rs. 13,100 |
| Best category | groupby("category").agg(...) | Power Banks Rs. 14,400 from 2 orders |
| Total revenue | df["revenue"].sum() | Rs. 38,850 from 10 orders |
For the category line, named aggregation gives readable column names:
df.groupby("category").agg(
    orders=("order_id", "count"),
    revenue=("revenue", "sum"),
).sort_values("revenue", ascending=False)
Notice what the raw file would have reported. With "ATD" and "abbottabad " counted separately, the leading city would look smaller than it is. With the date bug from Step 4, September would have lost two orders. Small errors in cleaning turn into wrong business decisions.
What Changed in Pandas 3.0, and Does It Affect You?
Pandas 3.0.0 was released on January 21, 2026, according to its release notes. If a pandas tutorial you find online was written before 2026, three changes are worth knowing.
- Text columns now use the str dtype. In Step 1,
info()printed str rather than object. The pandas 3.0 announcement recommends installing pyarrow alongside pandas for the best performance with this type. - Copy-on-Write is the only mode. Any result you take from a DataFrame now behaves like a separate copy. Old advice to sprinkle
.copy()everywhere to silence warnings no longer applies. - Chained assignment no longer works. A line like
df["qty"][df["city"] == "Haripur"] = 5now changes nothing and shows a ChainedAssignmentError warning. Write it in one step instead:df.loc[df["city"] == "Haripur", "qty"] = 5.
If an old tutorial's code gives a different result on your laptop, check it against these three points first.
The 12 Pandas Methods to Learn First
Pandas has hundreds of methods, but pandas for beginners comes down to a short list for your first month. These 12 did nearly all the work in the walkthrough above.
| Job | Method | What it does |
|---|---|---|
| Load | read_excel | Reads a file into a DataFrame |
| Inspect | info, value_counts | Shows column types, gaps and counts per value |
| Clean | drop_duplicates | Removes repeated rows |
| Clean | str.replace, str.strip | Edits text inside a column |
| Convert | to_datetime, astype | Turns text into dates or numbers |
| Gaps | fillna | Replaces missing values with your chosen value |
| Summarize | groupby, pivot_table | Totals by group, or a cross-table |
| Save | to_excel | Writes results back to an .xlsx file |
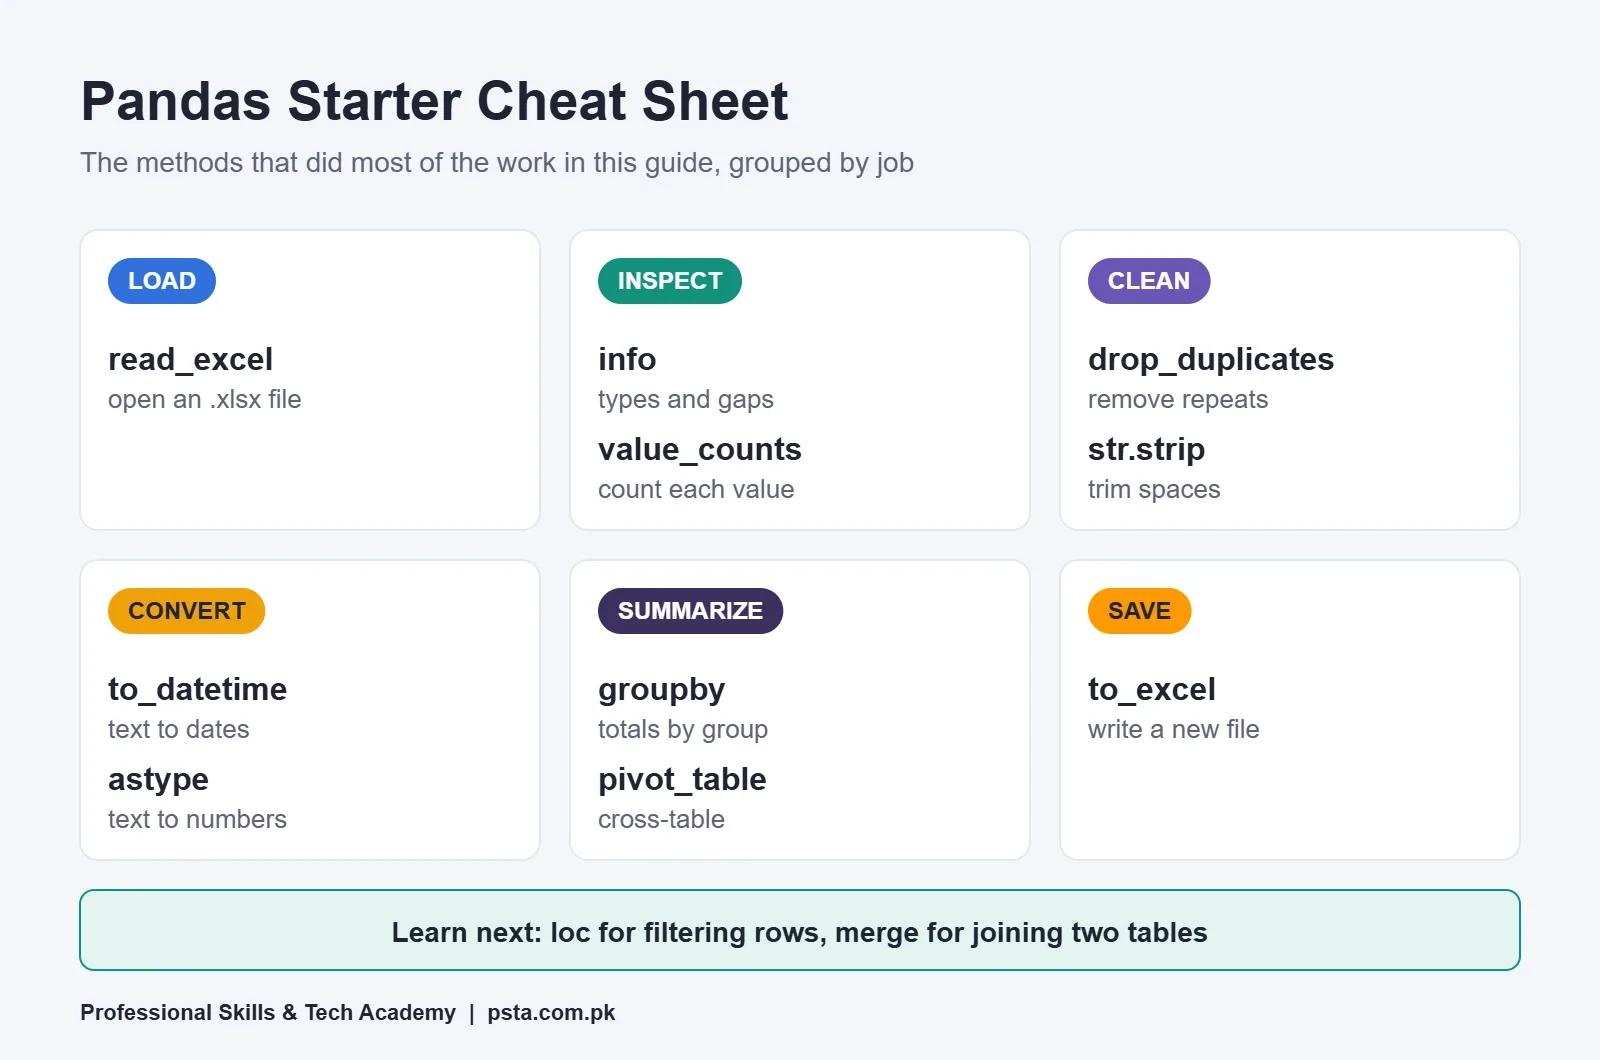
Once these feel natural, add merge for joining two tables and loc for filtering and updating rows. Those two open up most real reporting tasks.
Pandas for Beginners: Mistakes to Avoid With Messy Data
- Cleaning without looking first. Skipping
info()means you discover a text price column only when a sum fails. - Trusting a date parse because it didn't crash. Step 4 ran without an error and was still wrong. Always check a few converted dates by eye.
- Filling gaps with zero by habit. A zero quantity and an unknown quantity are different facts.
- Overwriting the raw export. Keep the original. Write cleaned data to a new file.
- Copying pre-2026 code blindly. Chained assignment changes nothing in pandas 3.
When an error does appear, our list of common Python errors and their fixes explains the messages beginners see most.
Pandas, Excel or Power BI: Which Tool for Which Task?
These tools work together; they don't compete. Excel is quickest for a small sheet you look at once; our walkthrough of a pivot table in Excel shows that route. Power BI is strongest when a manager wants an interactive dashboard that refreshes. Pandas fits the middle: repeatable cleaning, many files at once, and logic you can read line by line.
One practical pattern is to clean data with pandas, save a tidy file, then build the dashboard in Power BI. If that appeals to you, PSTA's Power BI course is a sensible next step after Python.
Learning Pandas Step by Step at PSTA
Pandas is taught inside PSTA's Advanced Python Programming Course, in the Data Science Essentials module with NumPy and Matplotlib. The course page lists these details:
- Duration: 12 weeks, with a new batch every month
- Starting point: no prior coding; the course begins with installing Python
- Fee: Rs. 30,000 against a listed regular fee of Rs. 40,000; you can pay it in 2 parts
- Related project: a data analysis report that loads a real dataset with pandas, summarizes it and plots charts
- Study options: classes at the Mandian campus in Abbottabad, live online from any city, or a mix of both
Before you start, the list of Python projects for beginners gives you a sense of the practice work. Programs that pair well with Python sit on the courses page. When you're ready, the admission form and process are one click away, or you can message +92 314 5424399 on WhatsApp if you'd like to check which time slots are open.
Your Weekend Exercise: Clean One Real Sheet
The best pandas for beginners practice is your own data. Pick one export you already have: a fee register, a stock list or a month of sales. Make a copy, load it with read_excel, and run info() and value_counts() on two columns. Write down every problem you spot before fixing any of them. That list is your first cleaning plan, and working through it will teach you more pandas than a week of reading.
Frequently asked questions
Is pandas hard to learn for beginners?
Not if you learn it on real problems. Most of the first month is about a dozen methods: reading a file, checking it with info(), removing duplicates, converting types, filling gaps and grouping. The harder part is judgment, such as deciding what a blank cell means or spotting a date that was read the wrong way. Practice on your own sheets and that judgment builds quickly.
Do I need to know Python before learning pandas?
You need the basics: variables, lists, dictionaries, functions and how to run a script or notebook. You do not need advanced topics like classes before starting. Many learners study pandas alongside core Python, since cleaning a real file gives a reason to practice loops, conditions and dictionaries. If any of those feel shaky, spend a week on them first.
Can pandas open Excel files directly?
Yes. pd.read_excel opens .xlsx files, and to_excel writes them back. For .xlsx files pandas uses the openpyxl package, so install it with pip install pandas openpyxl. The documentation says the default reader will change to calamine in a future version, so passing engine="openpyxl" keeps older scripts behaving the same.
Should I learn pandas or stick with Excel?
Learn both, for different jobs. Excel is faster for a small sheet you look at once or share with colleagues who do not code. Pandas earns its place when you repeat the same cleanup every month, combine several files, or handle more rows than Excel handles comfortably. A practical pattern is to clean data in pandas, then present it in Excel or Power BI.
Can I practice pandas without installing anything?
Yes. Google Colab runs Python notebooks in your browser, and its official FAQ says it is free and needs no setup. Free sessions can run for up to 12 hours and stop when idle, so save your work to Google Drive. This is a good option on a shared or low-spec computer, though a local install is better for daily work.
What changed in pandas 3.0 that affects beginners?
Three things matter most. Text columns now get the str dtype instead of object. Copy-on-Write is the only mode, so results taken from a DataFrame behave like copies. Chained assignment, such as df["a"][mask] = value, no longer changes the original; use df.loc[mask, "a"] = value instead. Older tutorials written before 2026 may still show the old patterns.
How should I practice pandas after this guide?
Take one file you already use, such as a fee register or stock list, and make a copy. Load it, run info() and value_counts() on a few columns, and list every problem before fixing anything. Then work through the list one step at a time and check the result after each change. Repeat with a different file each week.
Sources & references
- Stack Overflow Developer Survey 2025: Technology survey.stackoverflow.co
- pandas on PyPI pypi.org
- Python Downloads python.org
- Google Colab FAQ research.google.com
- pandas.read_excel documentation pandas.pydata.org
- pandas user guide: Working with missing data pandas.pydata.org
- pandas user guide: Group by pandas.pydata.org
- What's new in pandas 3.0.0 pandas.pydata.org
Last reviewed & updated on by Umar Qureshi. Written by the PSTA team in Abbottabad, Pakistan.

Umar Qureshi

Advanced Python Programming Course in Pakistan – Online Classes and On-Campus in Abbottabad
Turn this guide into a career: hands-on training with real projects, online across Pakistan or on-campus in Abbottabad · 12 weeks.
Comments
No comments yet — ask a question or share your experience.